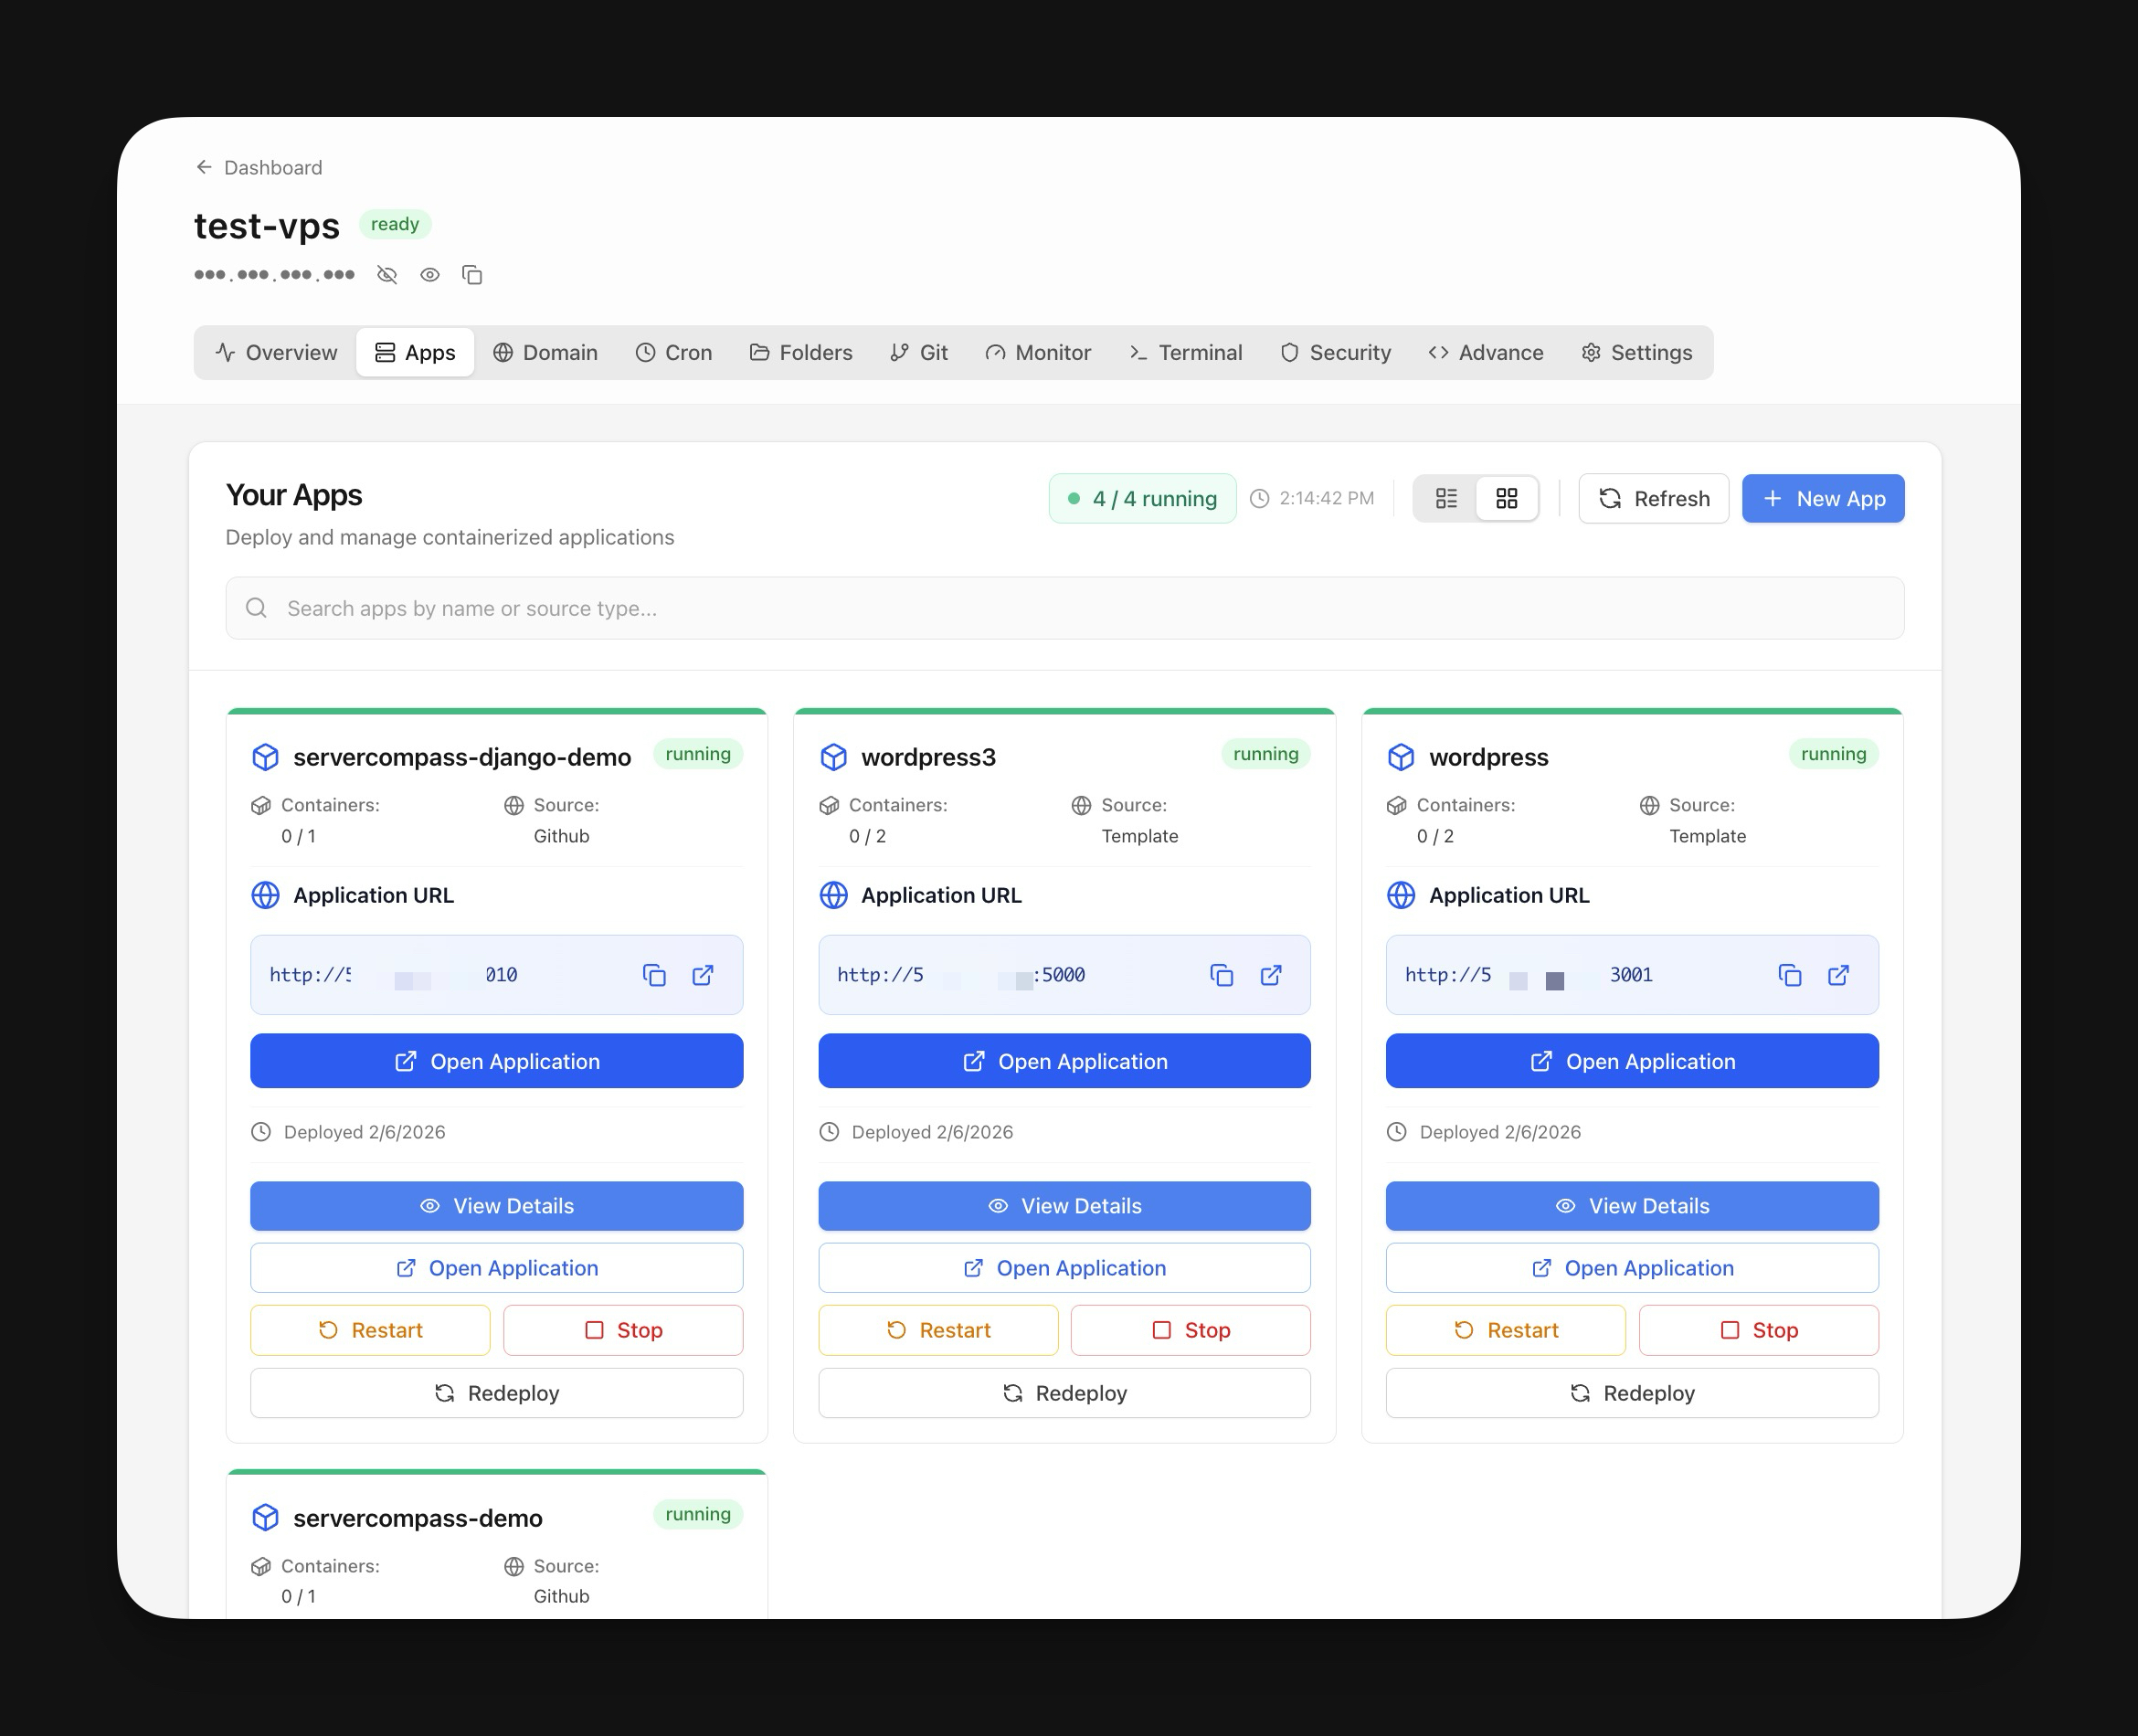
Application Dashboard
View all deployed applications with real-time status indicators. Switch between grid and table view for your preferred workflow.
Using Application Dashboard in Server Compass
No documentation needed. Application Dashboard guides you through each step visually.
Open Dashboard
Navigate to your application dashboard to see all deployed apps.
Use Application Dashboard
Access Application Dashboard from the application detail view.
Take Action
Apply changes and monitor results in real time.
Life Without Application Dashboard
Here's what developers do without Application Dashboard: open terminal, SSH in, type commands, hope nothing breaks.
SSH into your server
Connect to your server via terminal.
ssh root@your-server-ipList all containers
See what's running (and what's crashed).
docker ps -a
# Good luck remembering which container is which
# CONTAINER ID   IMAGE          STATUS
# a1b2c3d4e5f6   myapp:v1.2.3   Up 2 days
# f6e5d4c3b2a1 myapp:v1.2.2 Exited (1) 3 days agoCheck container logs
Dig through logs to find errors.
docker logs container_name --tail 500
# Scroll through 500 lines of unformatted text
# grep for errors manually
No syntax highlighting, no search, no filtering.
Restart a container
Stop and start the container manually.
docker compose stop app
docker compose start app
# Or the nuclear option:
docker compose down && docker compose up -dRollback to previous version
Hope you tagged your images properly.
# First, find the old image
docker images | grep myapp
# Edit docker-compose.yml to use old tag
nano docker-compose.yml
# Change image: myapp:latest to myapp:v1.2.2
docker compose up -d
If you didn't tag versions... good luck.
Life's Too Short for Terminal Commands
Stop copy-pasting commands from Stack Overflow. Application Dashboard gives you a proper interface for server management.
- One-click actions
- Real-time feedback
- Automatic backups
- Zero CLI knowledge required
Everything Application Dashboard Offers
Everything you need for app management in one integrated tool, replacing complex CLI commands and manual configuration.
Get StartedThe Power of Application Dashboard
Server management shouldn't require a DevOps team. Application Dashboard makes professional-grade app management accessible to everyone.
Complete Visibility
Application Dashboard gives you a bird's-eye view of all your applications. No more guessing container states.
Instant Actions
Application Dashboard puts start, stop, restart, and rollback at your fingertips with one-click controls.
Safe Operations
Application Dashboard includes safety guards and confirmations to prevent accidental destructive actions.
Historical Context
Application Dashboard keeps a full audit trail so you always know what changed and when.
Application Dashboard: Frequently Asked
Common questions about Application Dashboard in Server Compass
How do I access Application Dashboard in Server Compass?
Application Dashboard is available in the App Management section of Server Compass. Simply connect to your server, navigate to App Management, and you'll find Application Dashboard ready to use. No additional setup or plugins required.
Does Application Dashboard require any server-side installation?
No. Server Compass operates as a desktop application that connects to your server via SSH. Application Dashboard works through this connection without installing any agents or packages on your server (except the optional monitoring agent for resource tracking).
Is Application Dashboard included in all Server Compass plans?
Yes. Every Server Compass feature, including Application Dashboard, is included with the one-time $29 payment. There are no tier restrictions, add-ons, or per-server fees. You get all 114+ features for all your servers.
Can I use Application Dashboard with any VPS provider?
Application Dashboard works with any VPS or dedicated server that supports SSH access and Docker. This includes DigitalOcean, Hetzner, Vultr, Linode, AWS EC2, Google Cloud, Azure, and any other provider. It also works with local servers and homelab setups.
What makes Application Dashboard different from command-line alternatives?
Application Dashboard provides a visual, intuitive interface that replaces complex CLI commands and configuration files. You get real-time feedback, safety confirmations, and a consistent experience across all your servers without memorizing syntax or writing scripts.
More App Management Features
Explore other app management capabilities in Server Compass
Grid & Table View
Toggle between visual grid cards and compact table view. See container status, uptime, and quick actions at a glance.
Container Health Monitoring
Real-time container status with uptime tracking, health check indicators, and resource usage per container.
Zero-Downtime Deployment
Blue-green deployment strategy ensures zero interruption. Health checks validate new containers before switching traffic.
Staging & Preview Environments
Create staging and preview environments alongside production. Preview branches auto-delete on a timer, and promote to production with one click.
Try Application Dashboard Today
Download Server Compass and get access to Application Dashboard along with 113 other features. One-time $29 payment. No subscriptions. No per-server fees.