
1
Step 1Open the server Apps tab
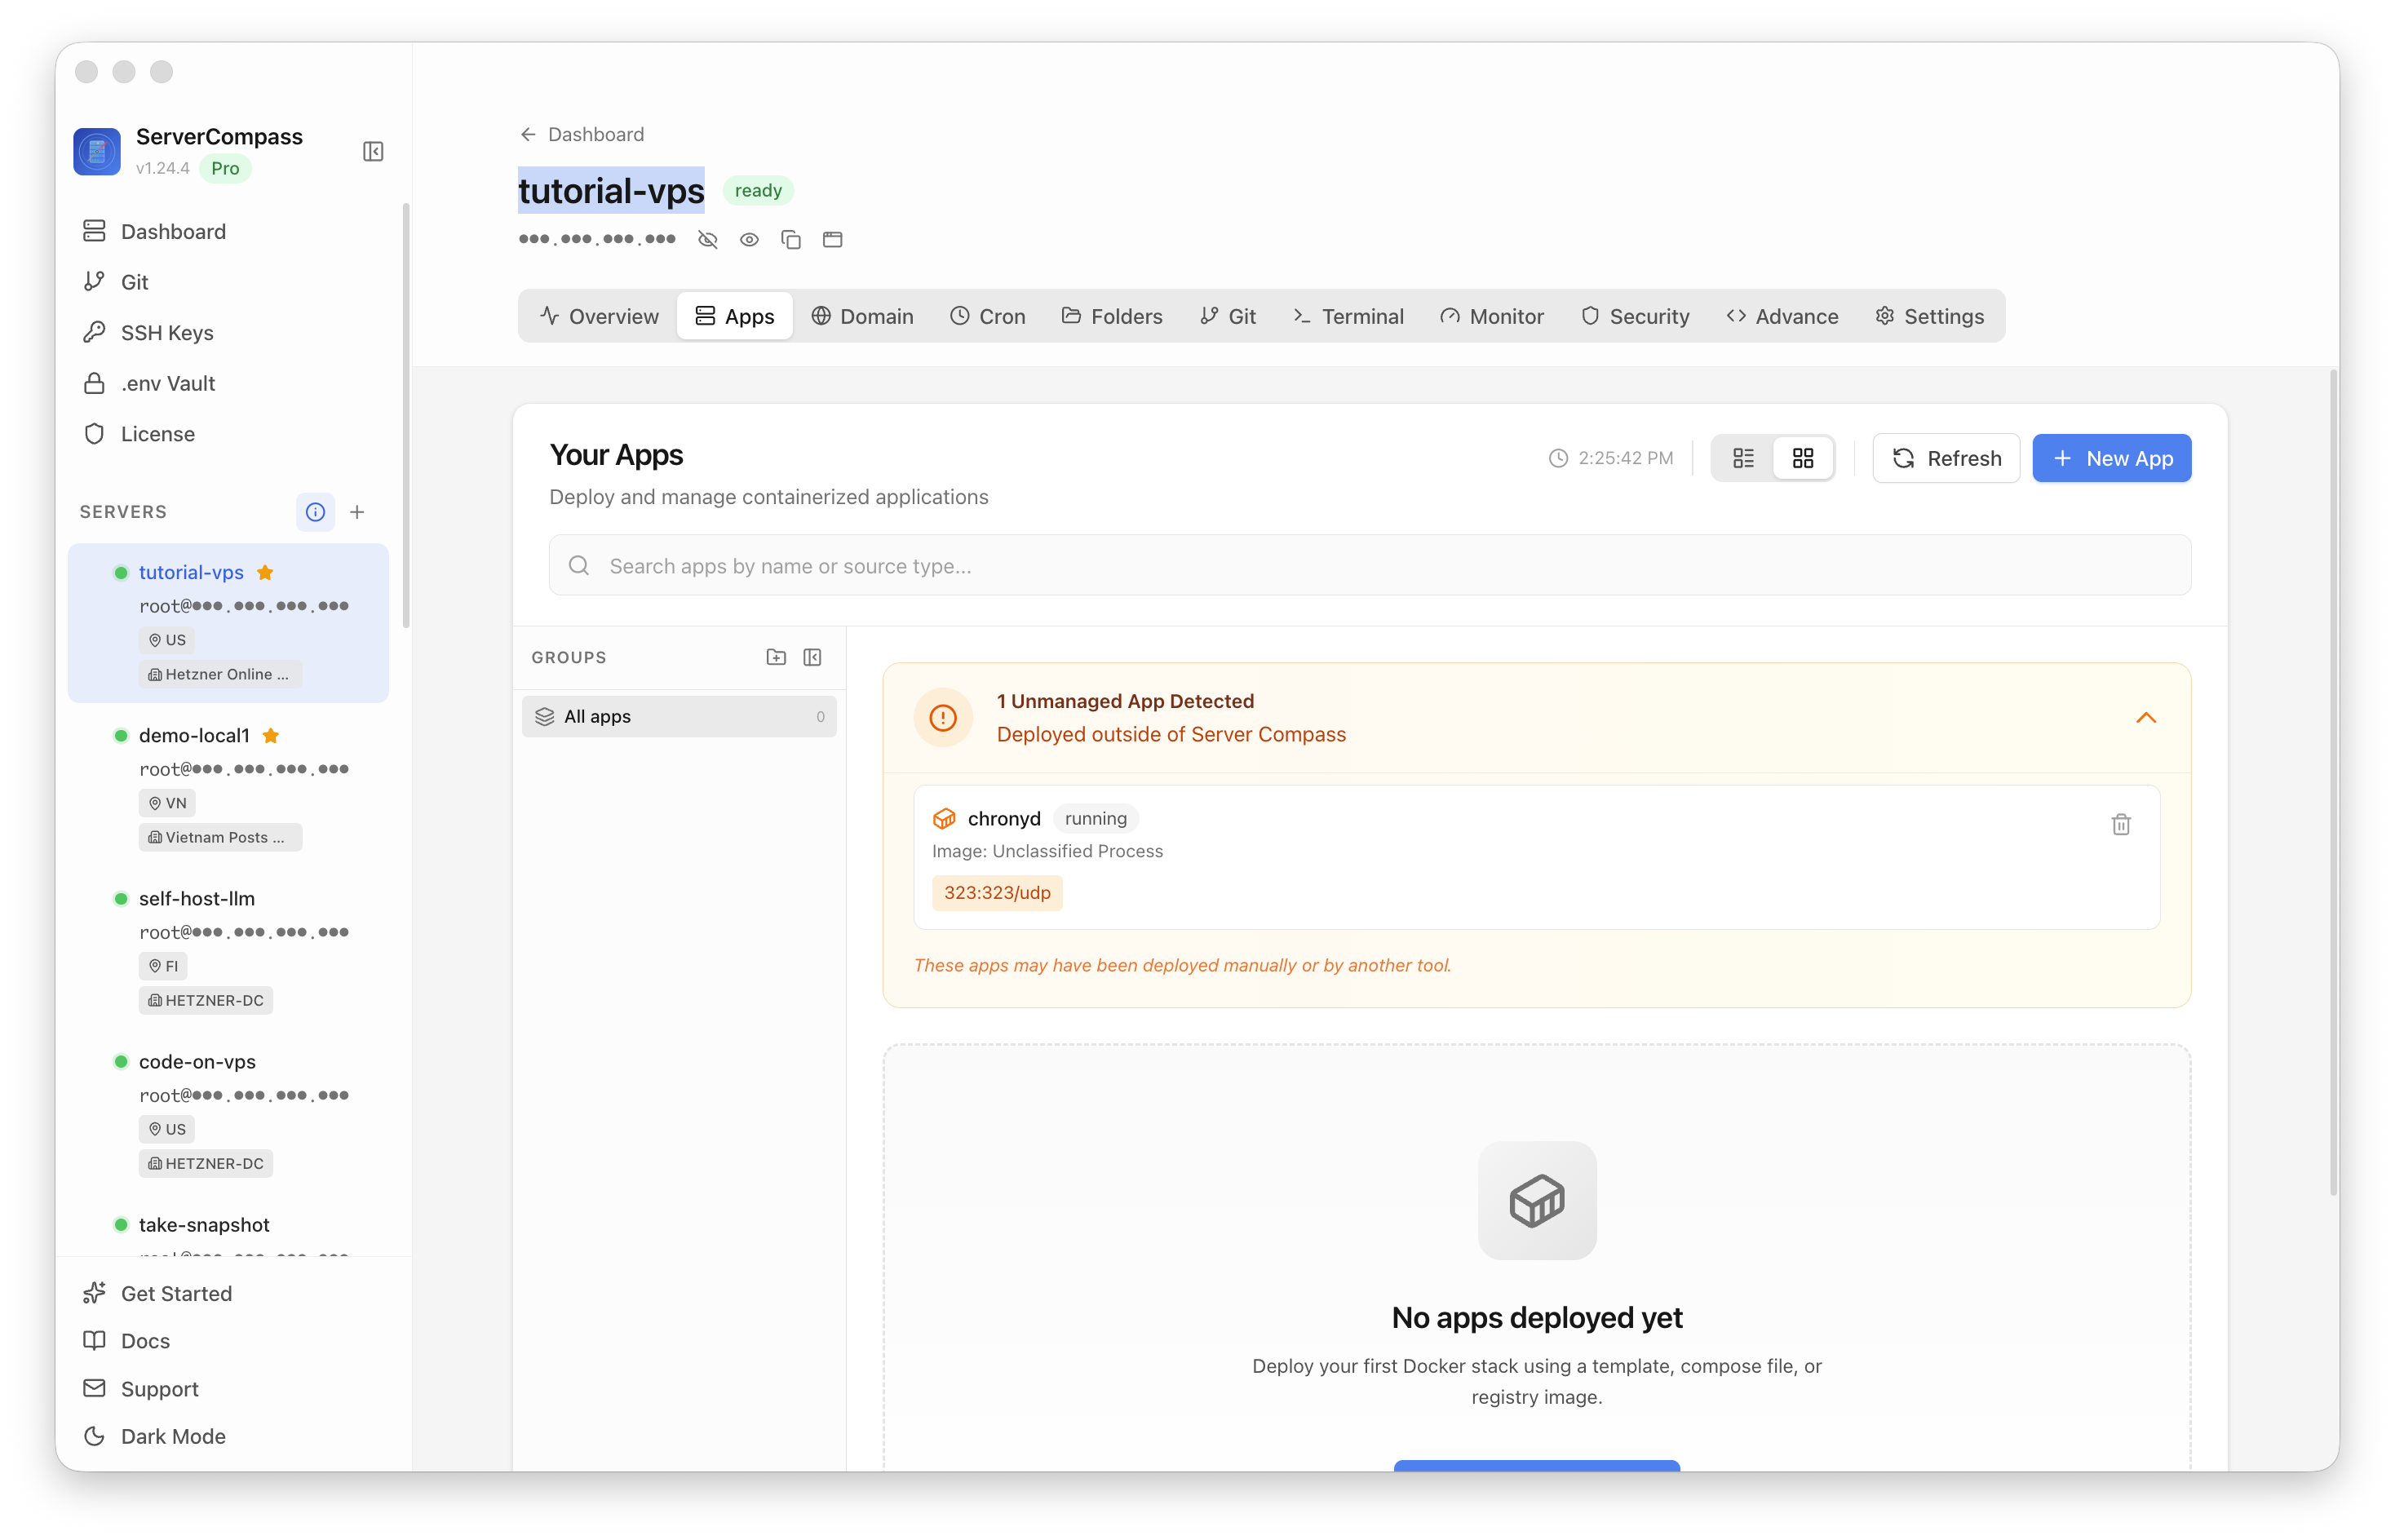
Select your VPS, open the Apps tab, and start a new app deployment. Keep sensitive server details hidden before capturing or sharing screenshots.

Open-source analytics and monitoring platform
Add your server credentials to Server Compass
Choose from our template library
Fill in settings and click Deploy
Use the Grafana template in Server Compass to deploy a self-hosted monitoring dashboard on your VPS, then open the Grafana login screen in a browser.
Select your VPS, open the Apps tab, and start a new app deployment. Keep sensitive server details hidden before capturing or sharing screenshots.
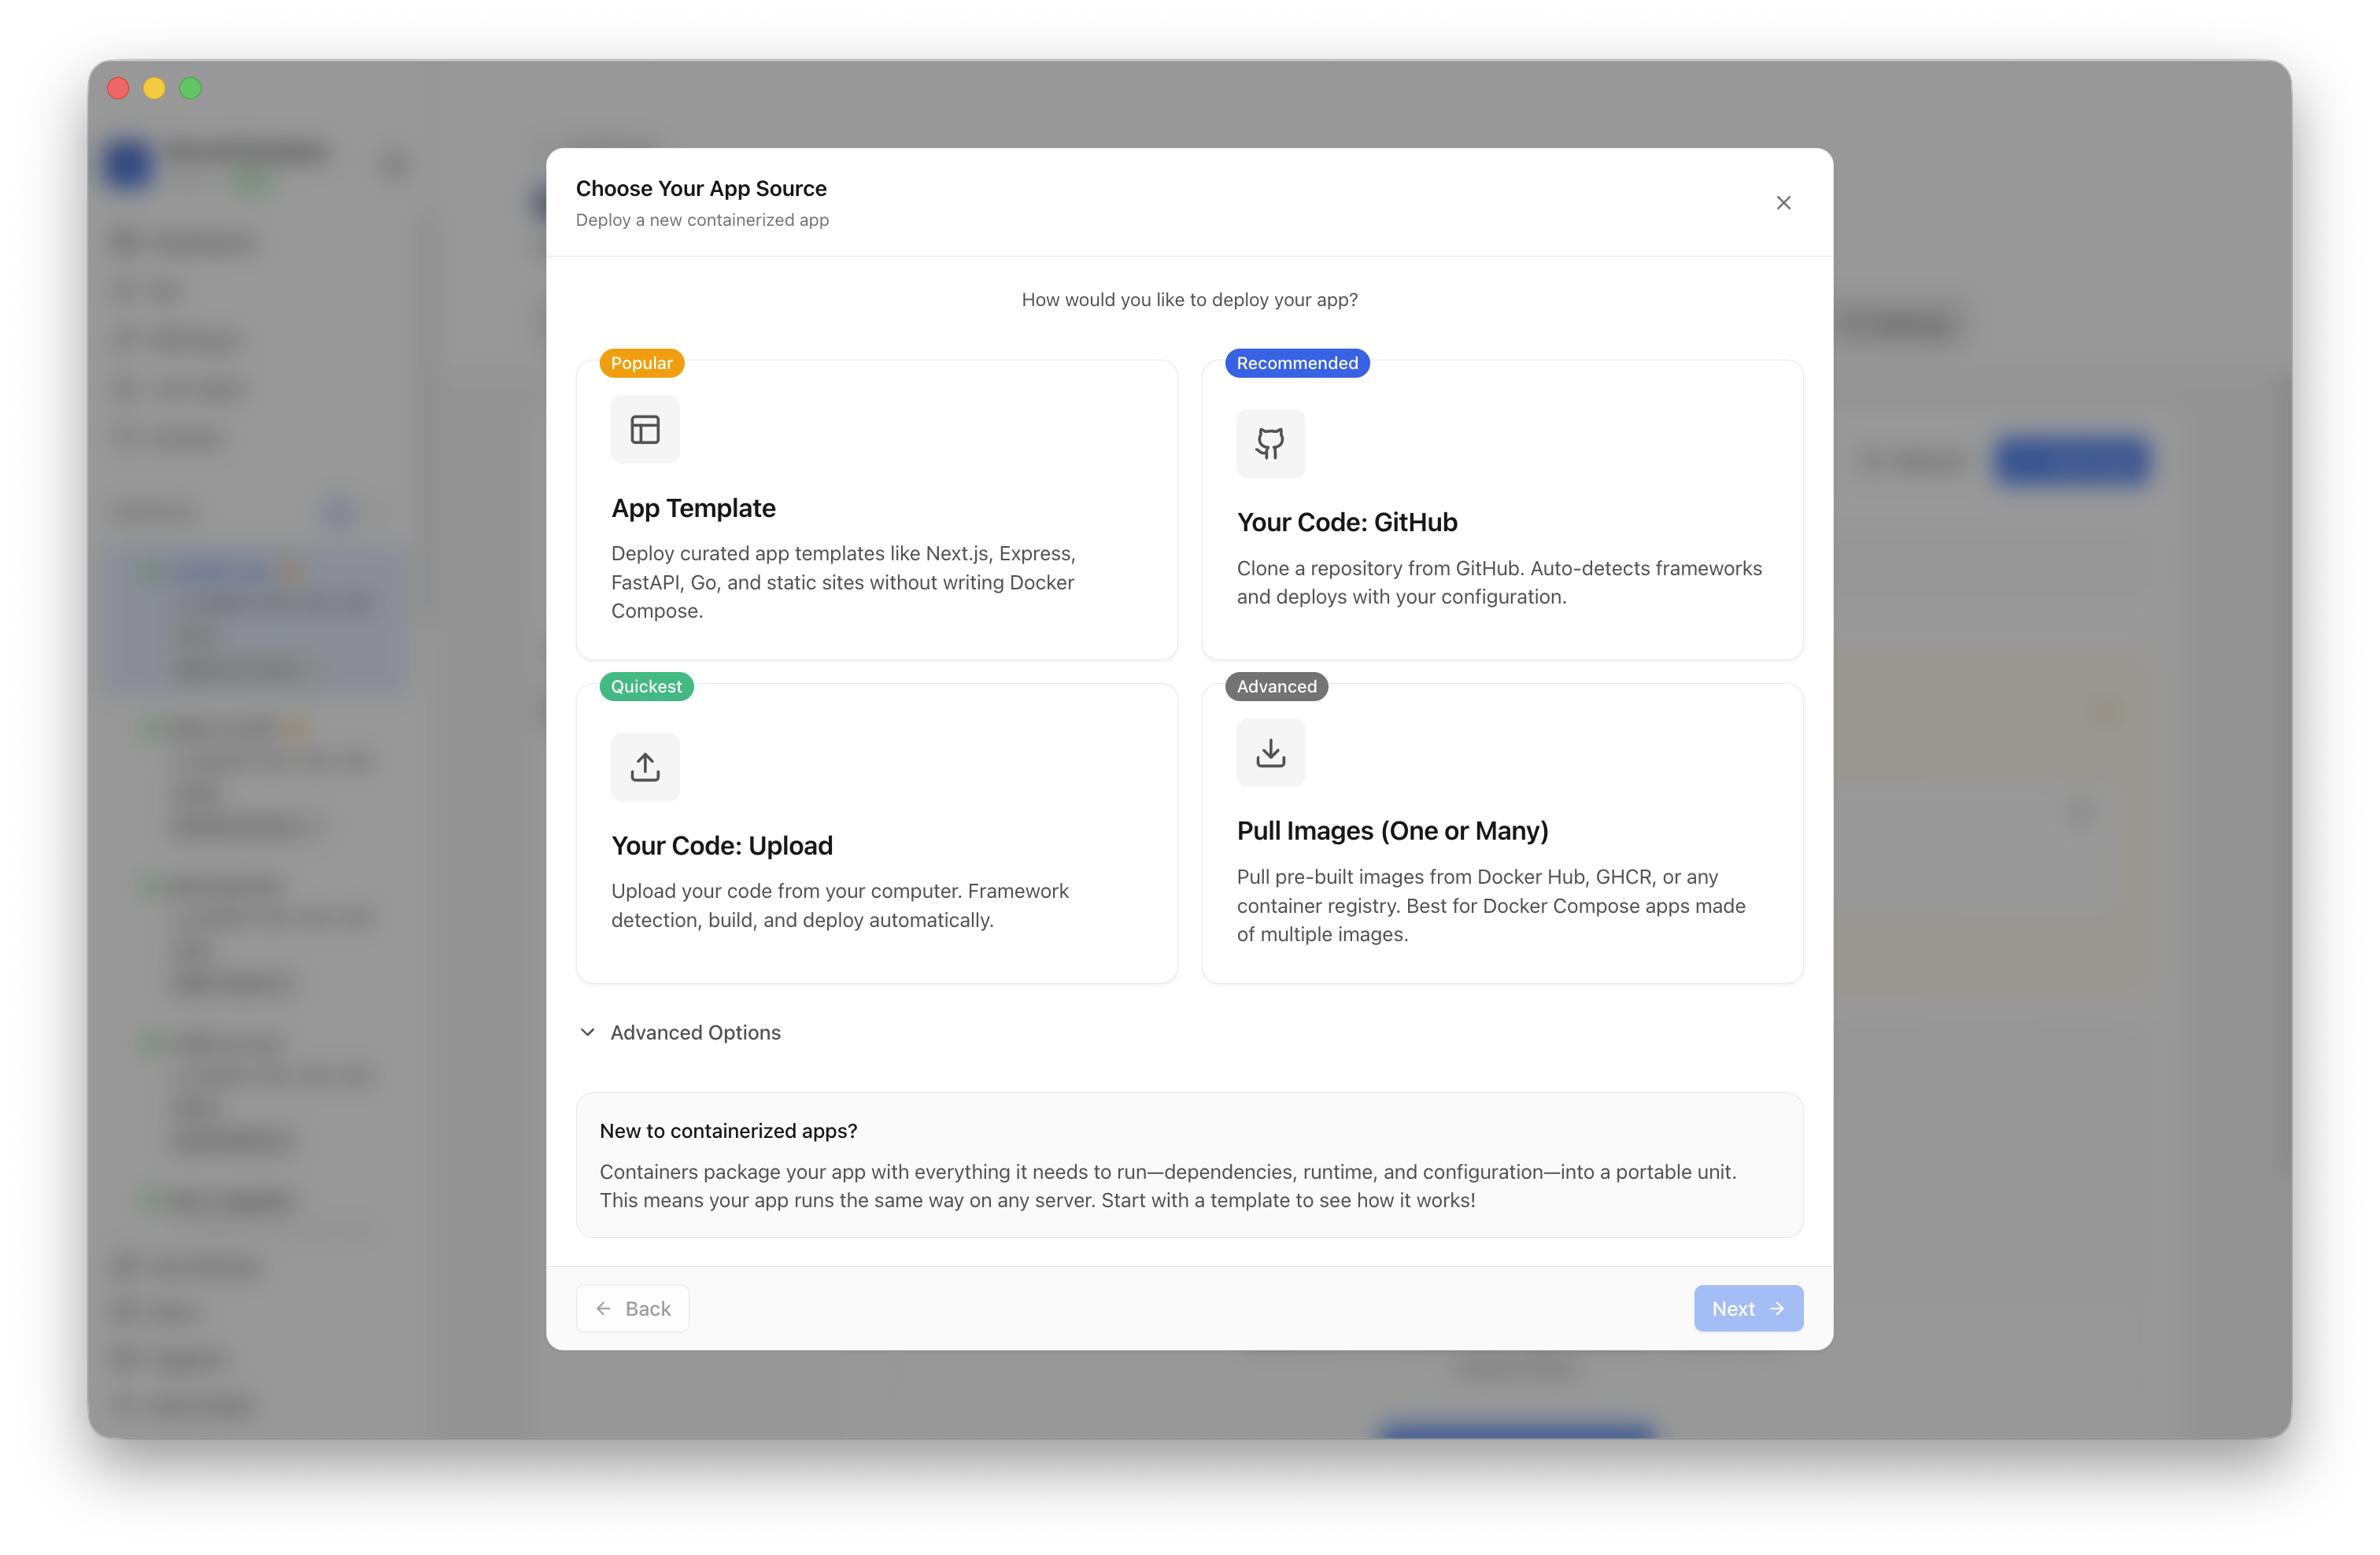
Click New App and choose the template deployment path so Server Compass can load the built-in catalog.
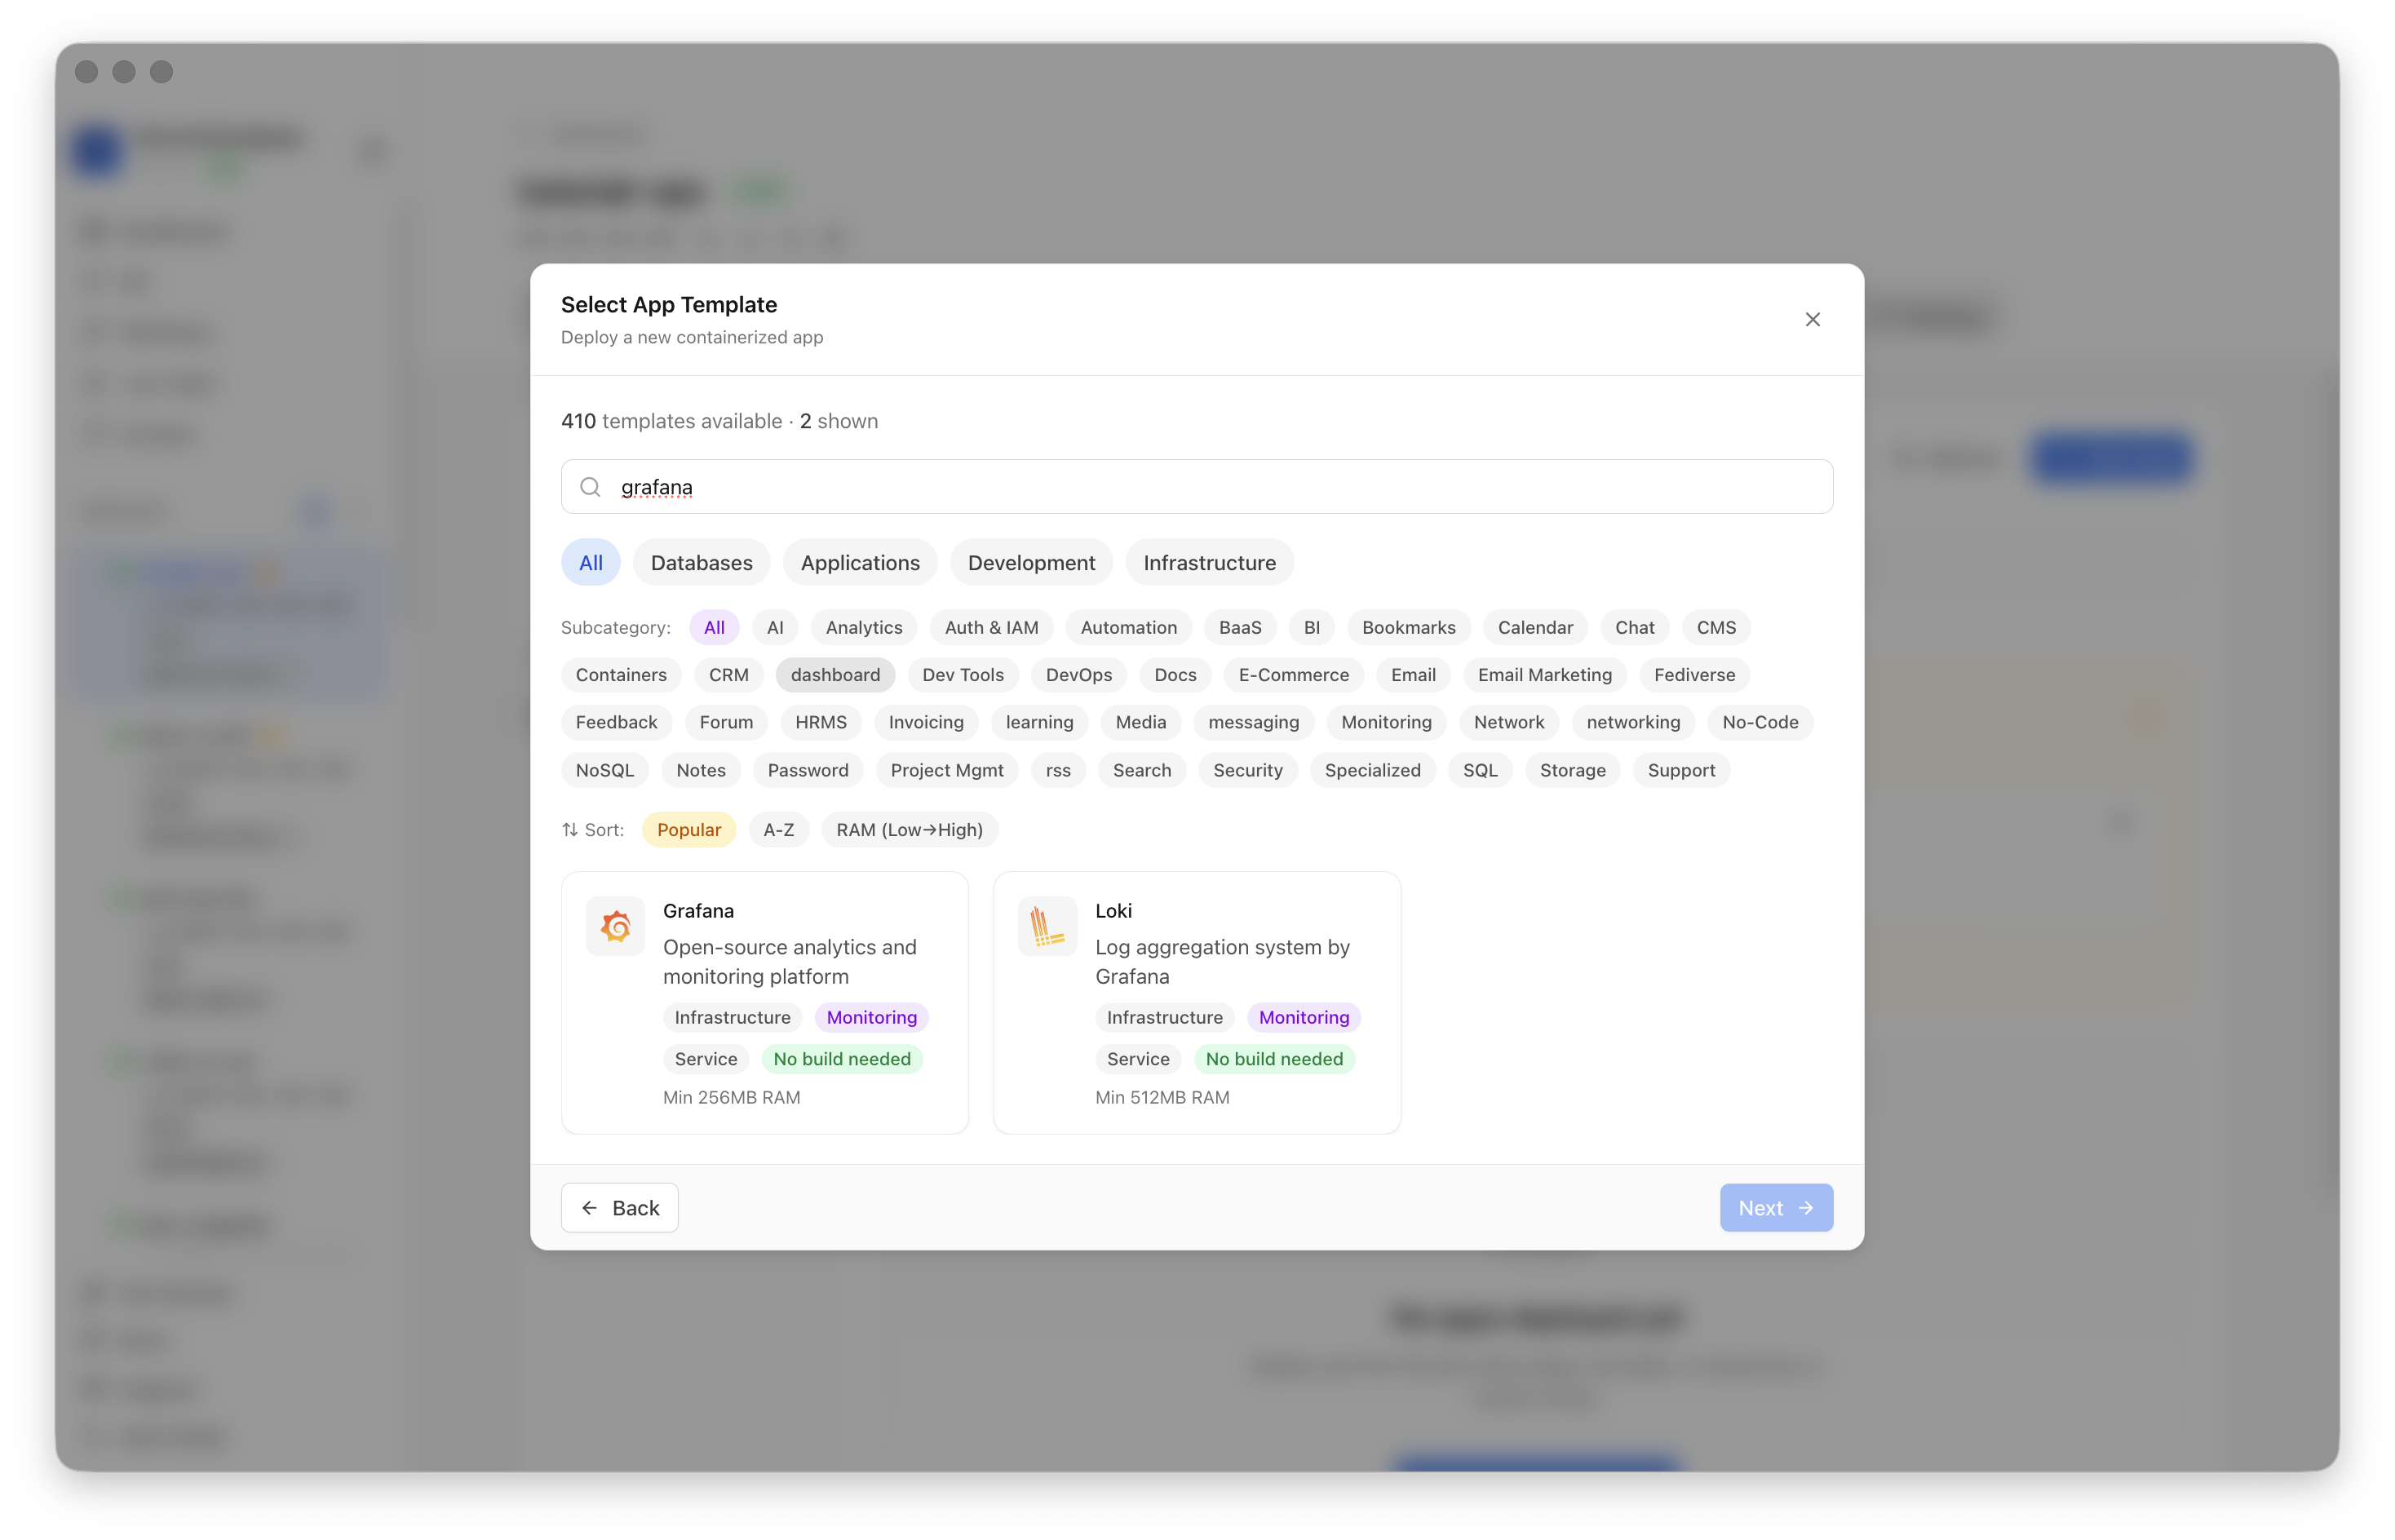
Use the template picker search to find Grafana in the Server Compass template catalog.
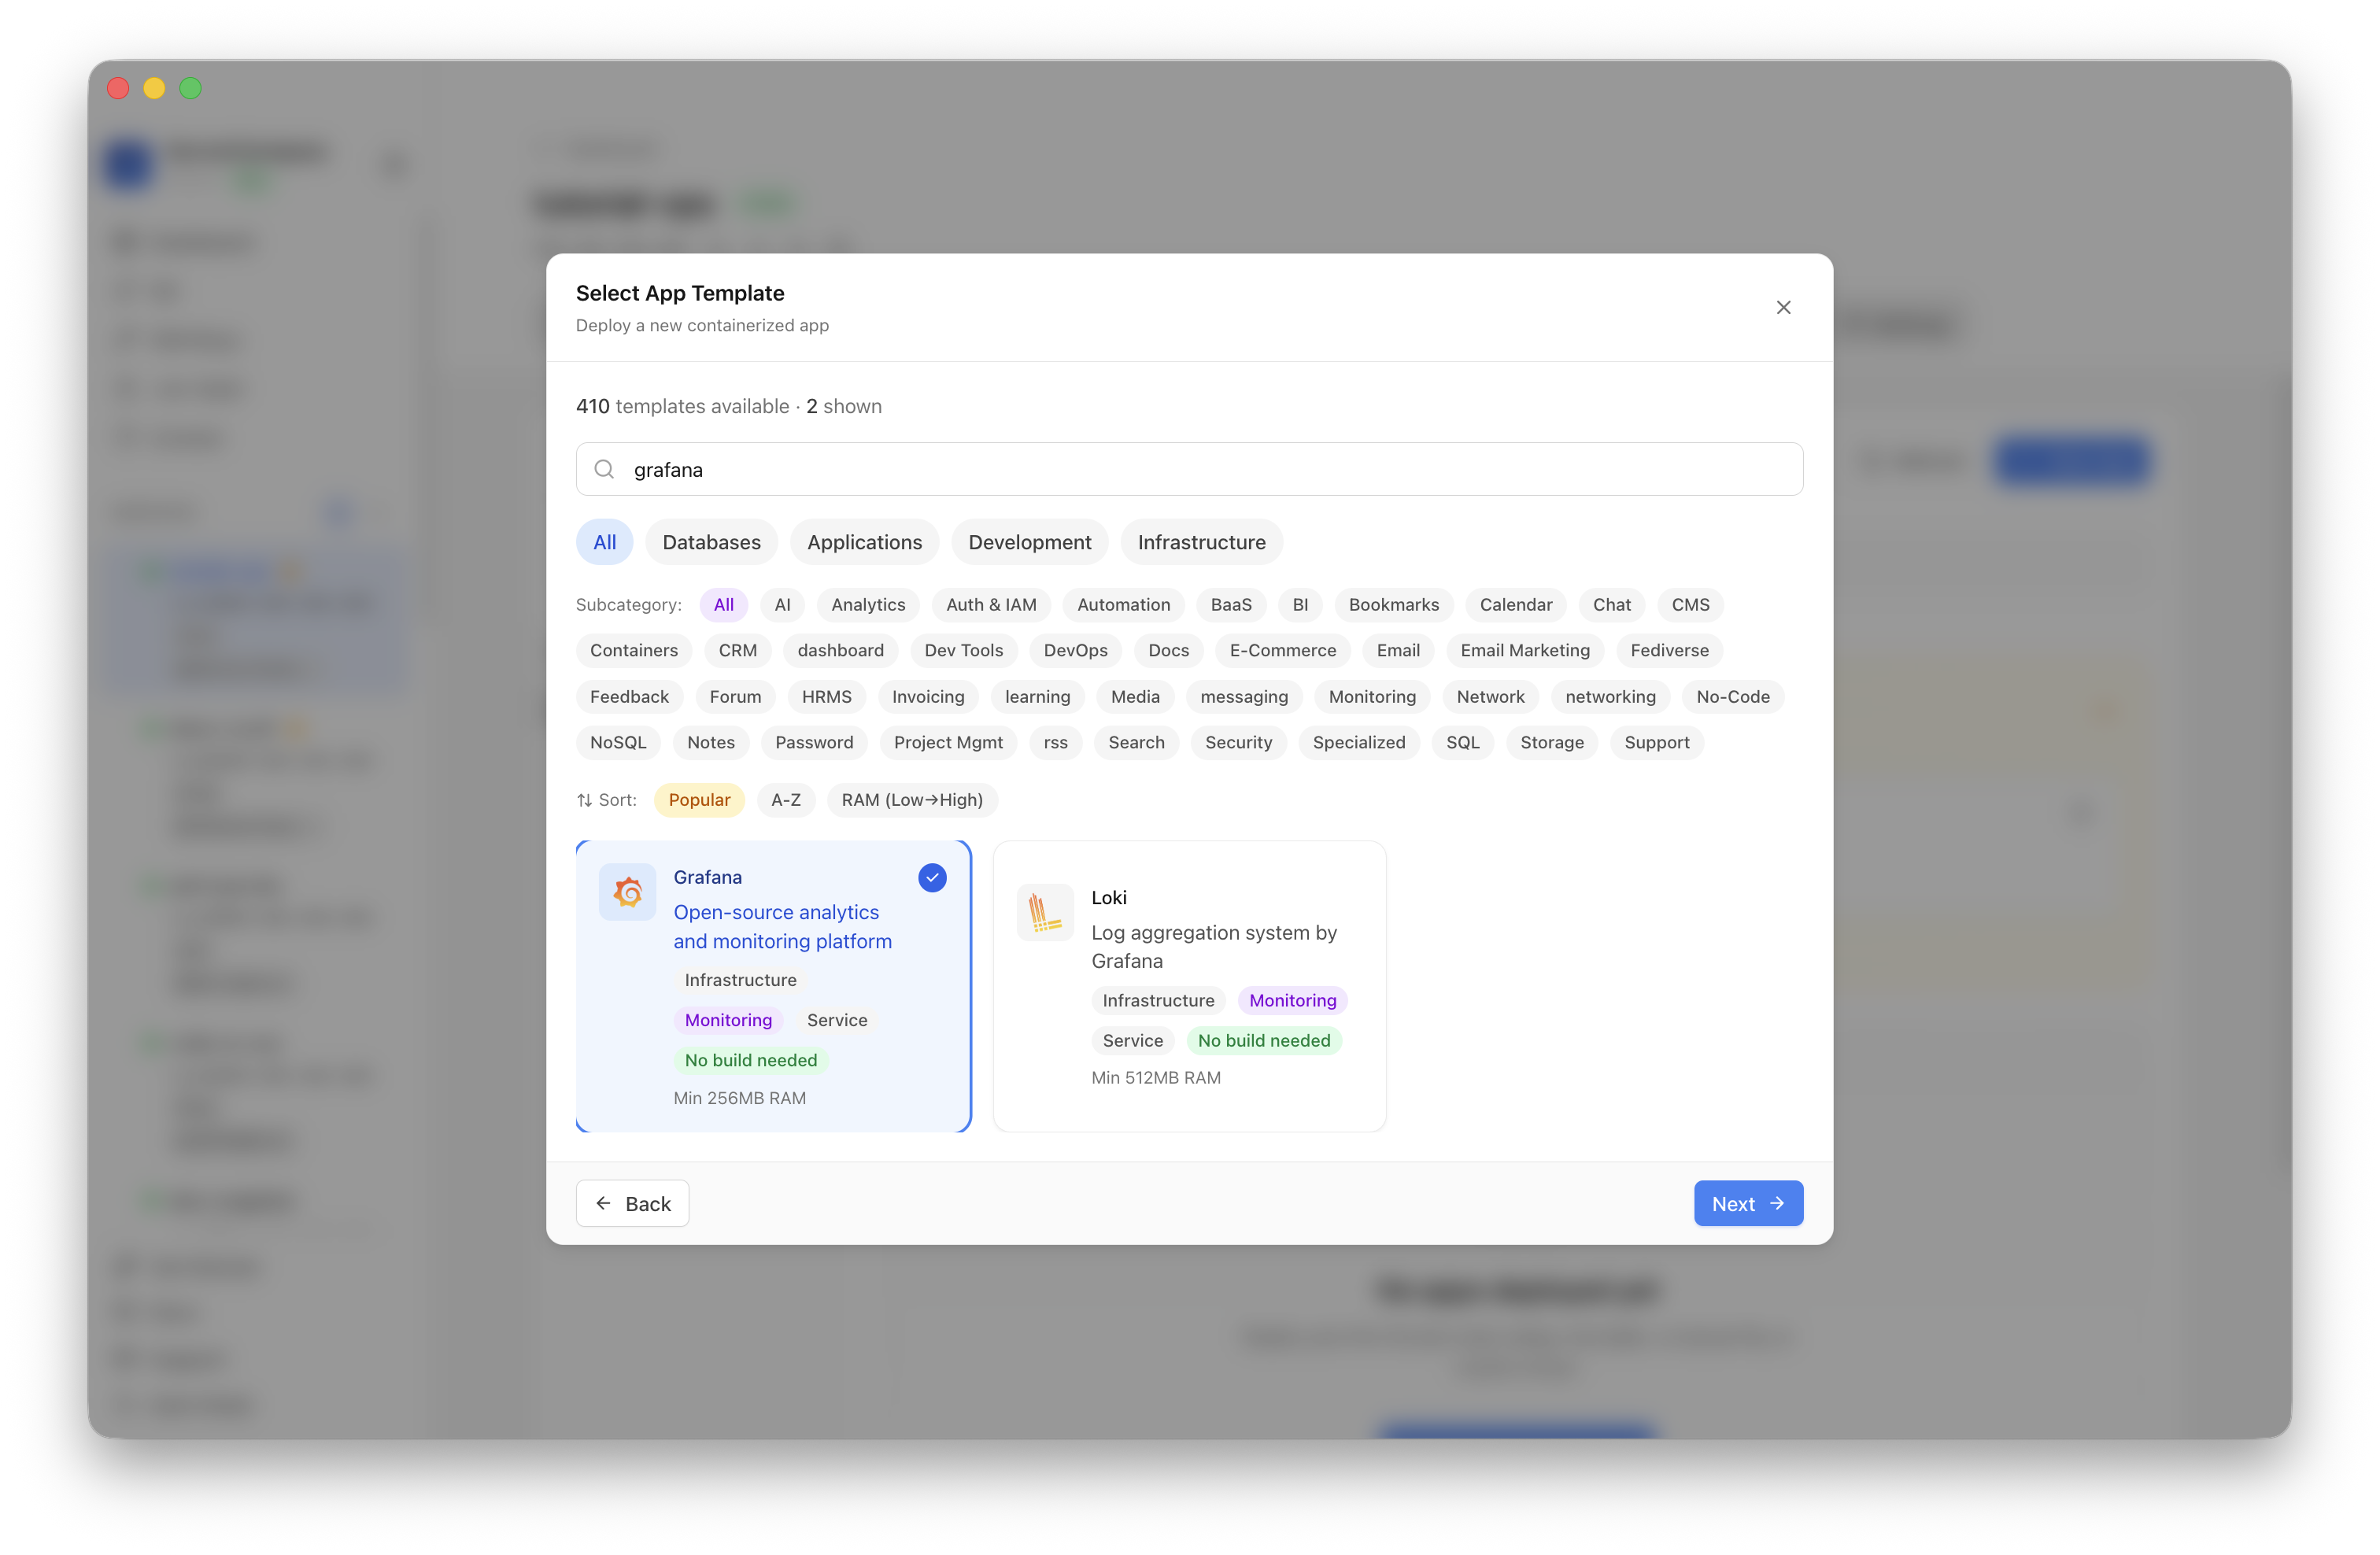
Choose the Grafana template. Server Compass fills the Grafana image, persistent data volume, admin variables, and default web port.
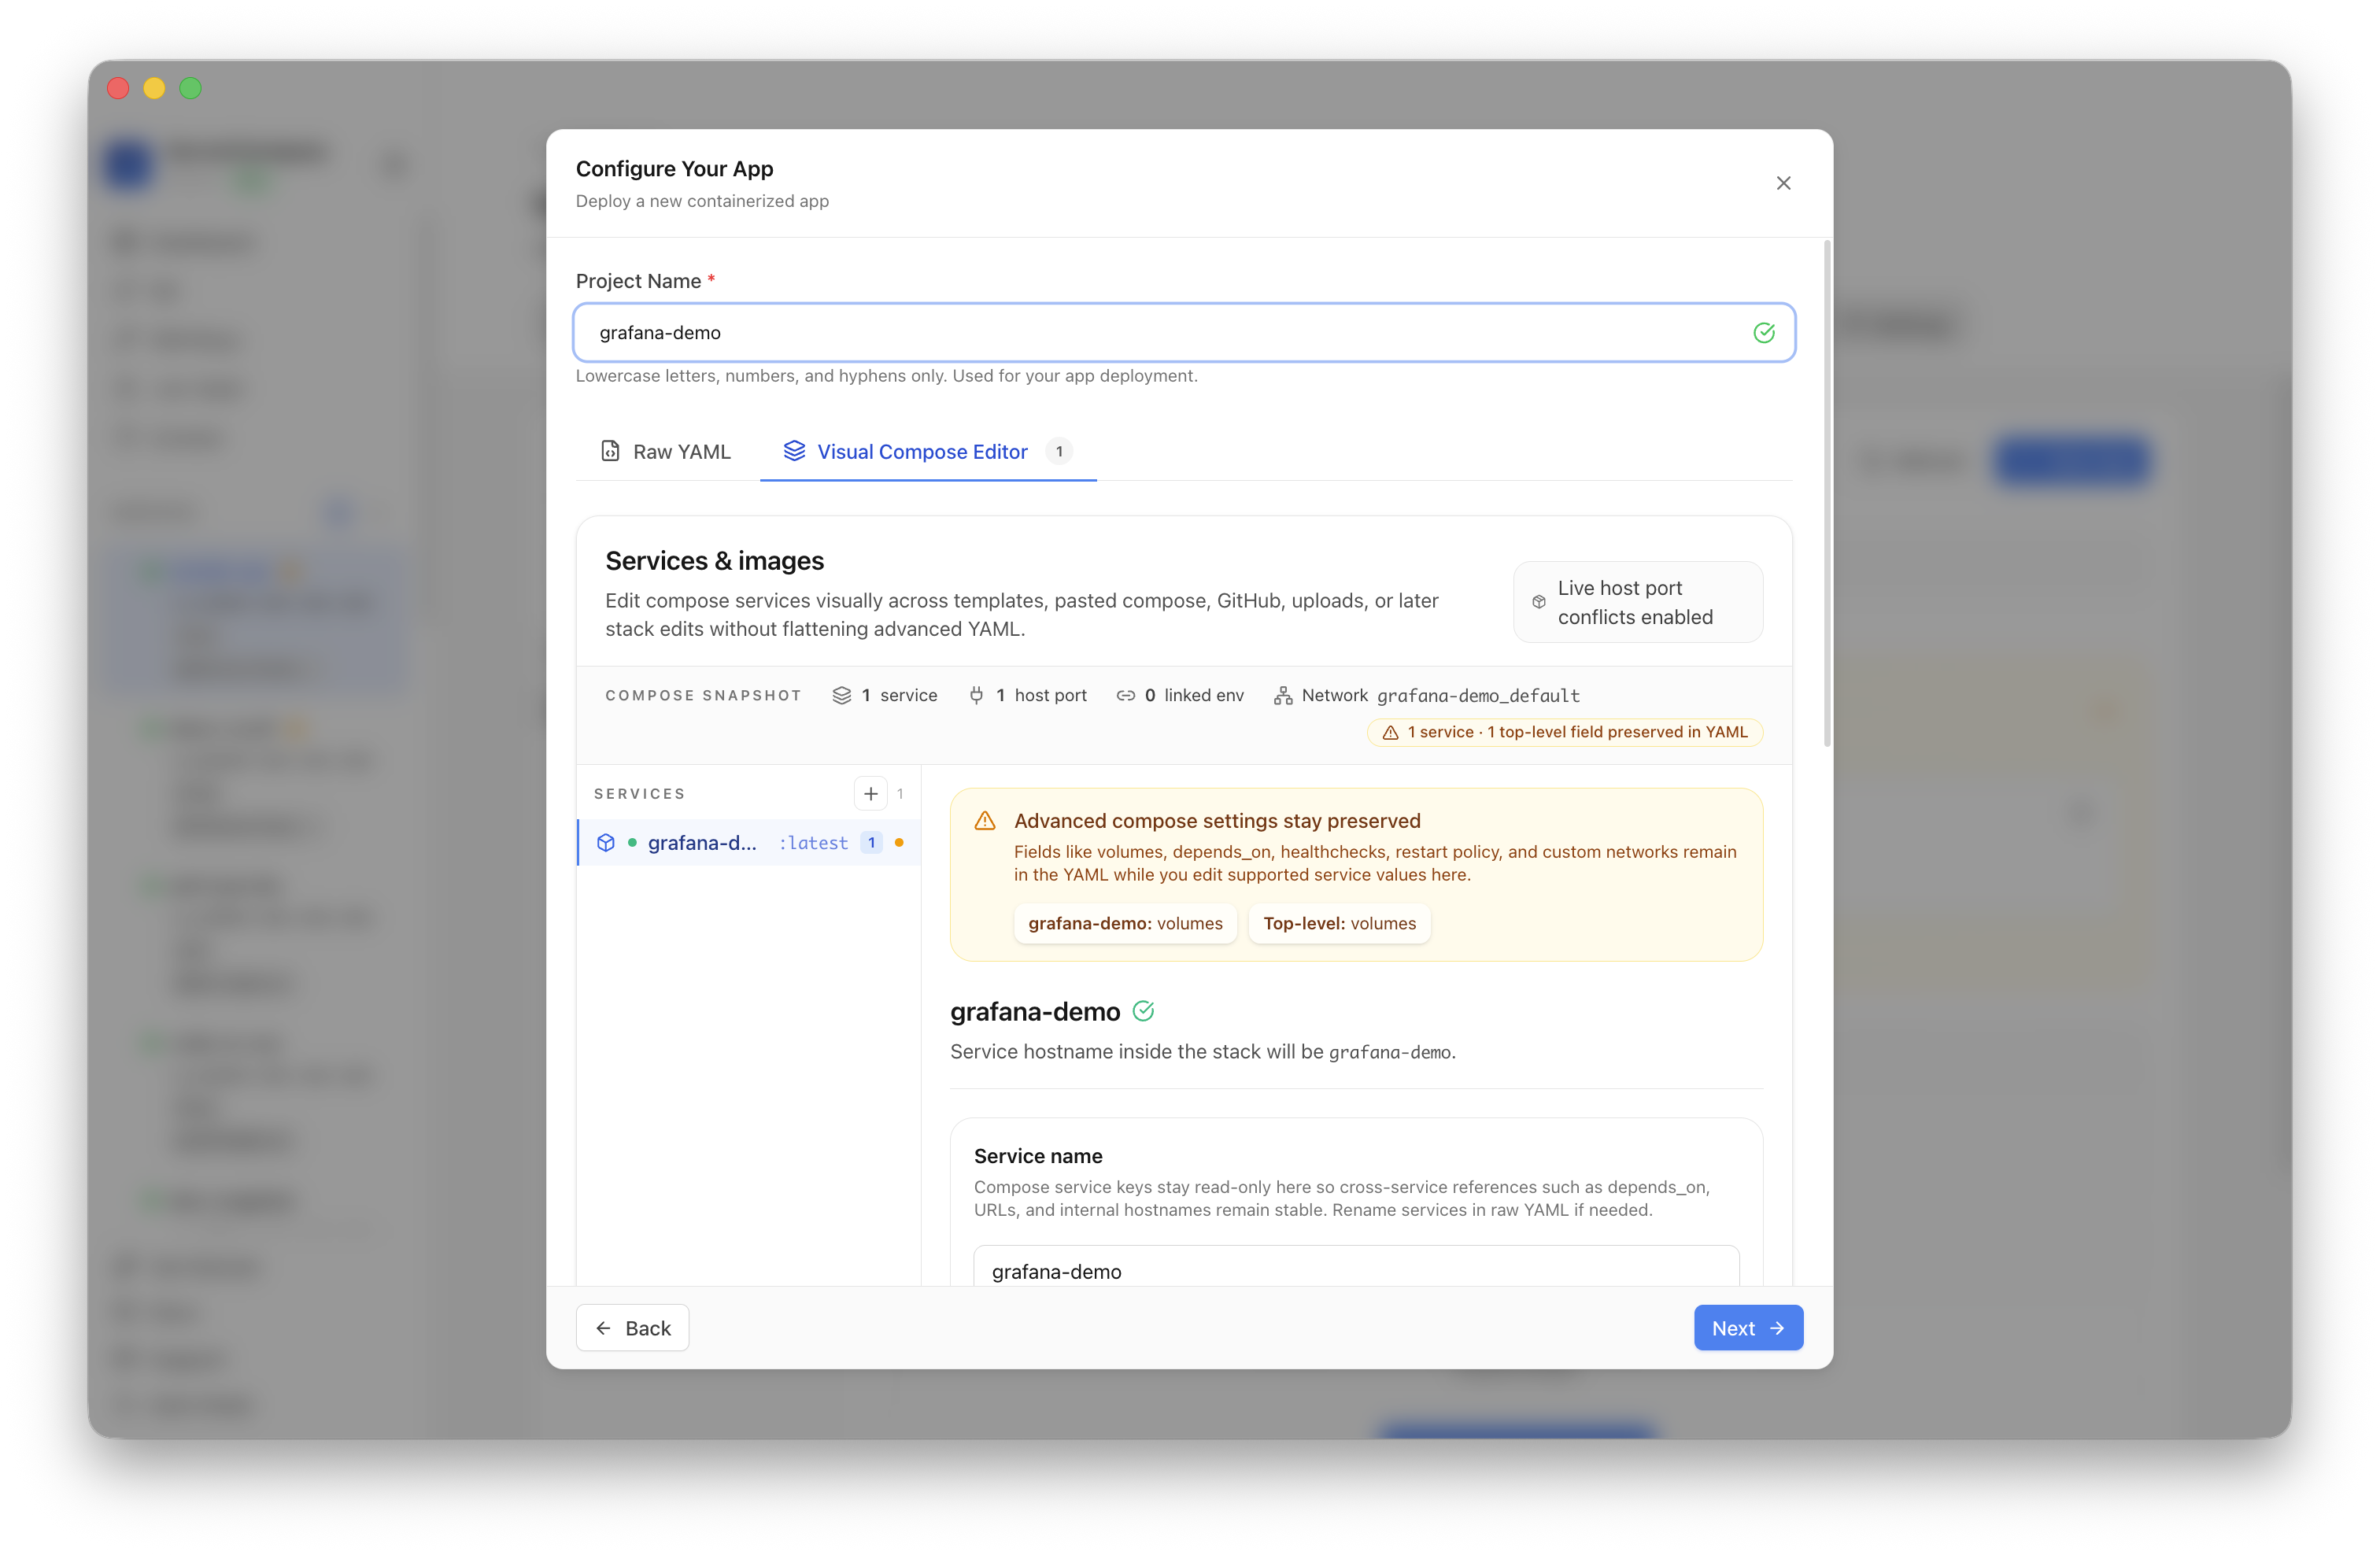
Confirm the app name, service image, volume, and host port. In the pilot run, the app was named grafana-demo and used host port 3000.
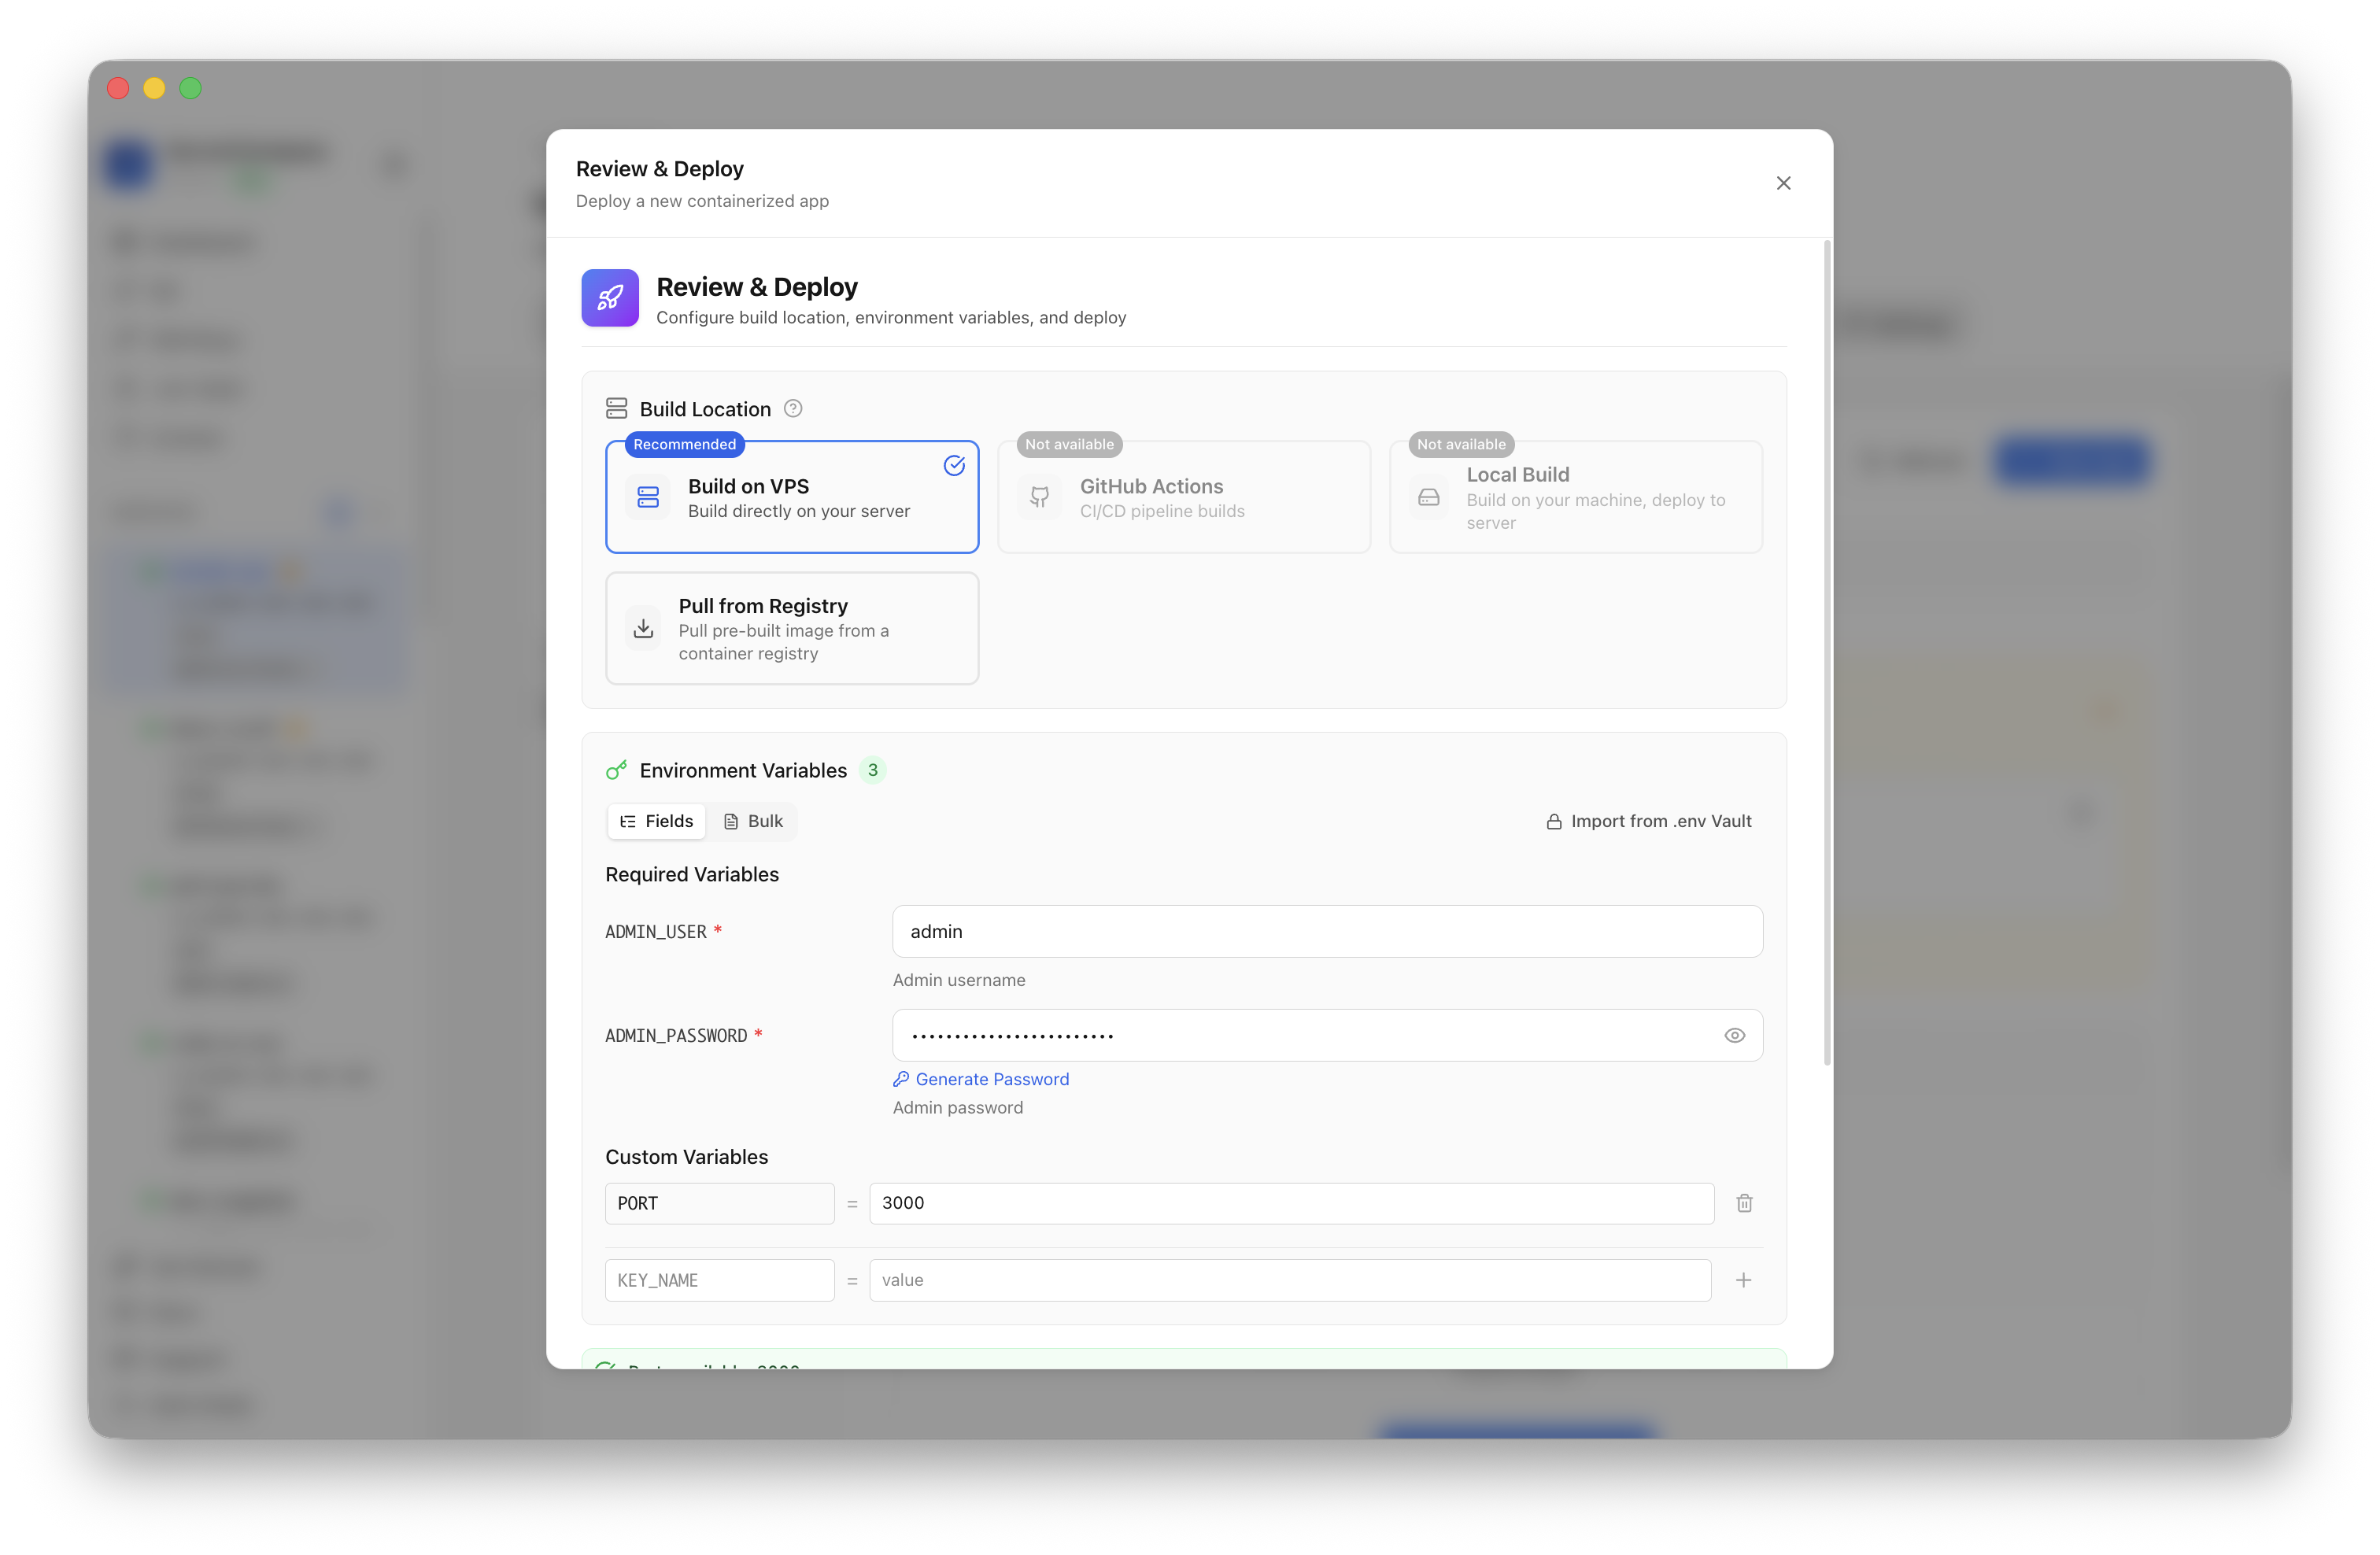
Review the admin username, masked admin password, and host port. When the port check passes, click Deploy Now.
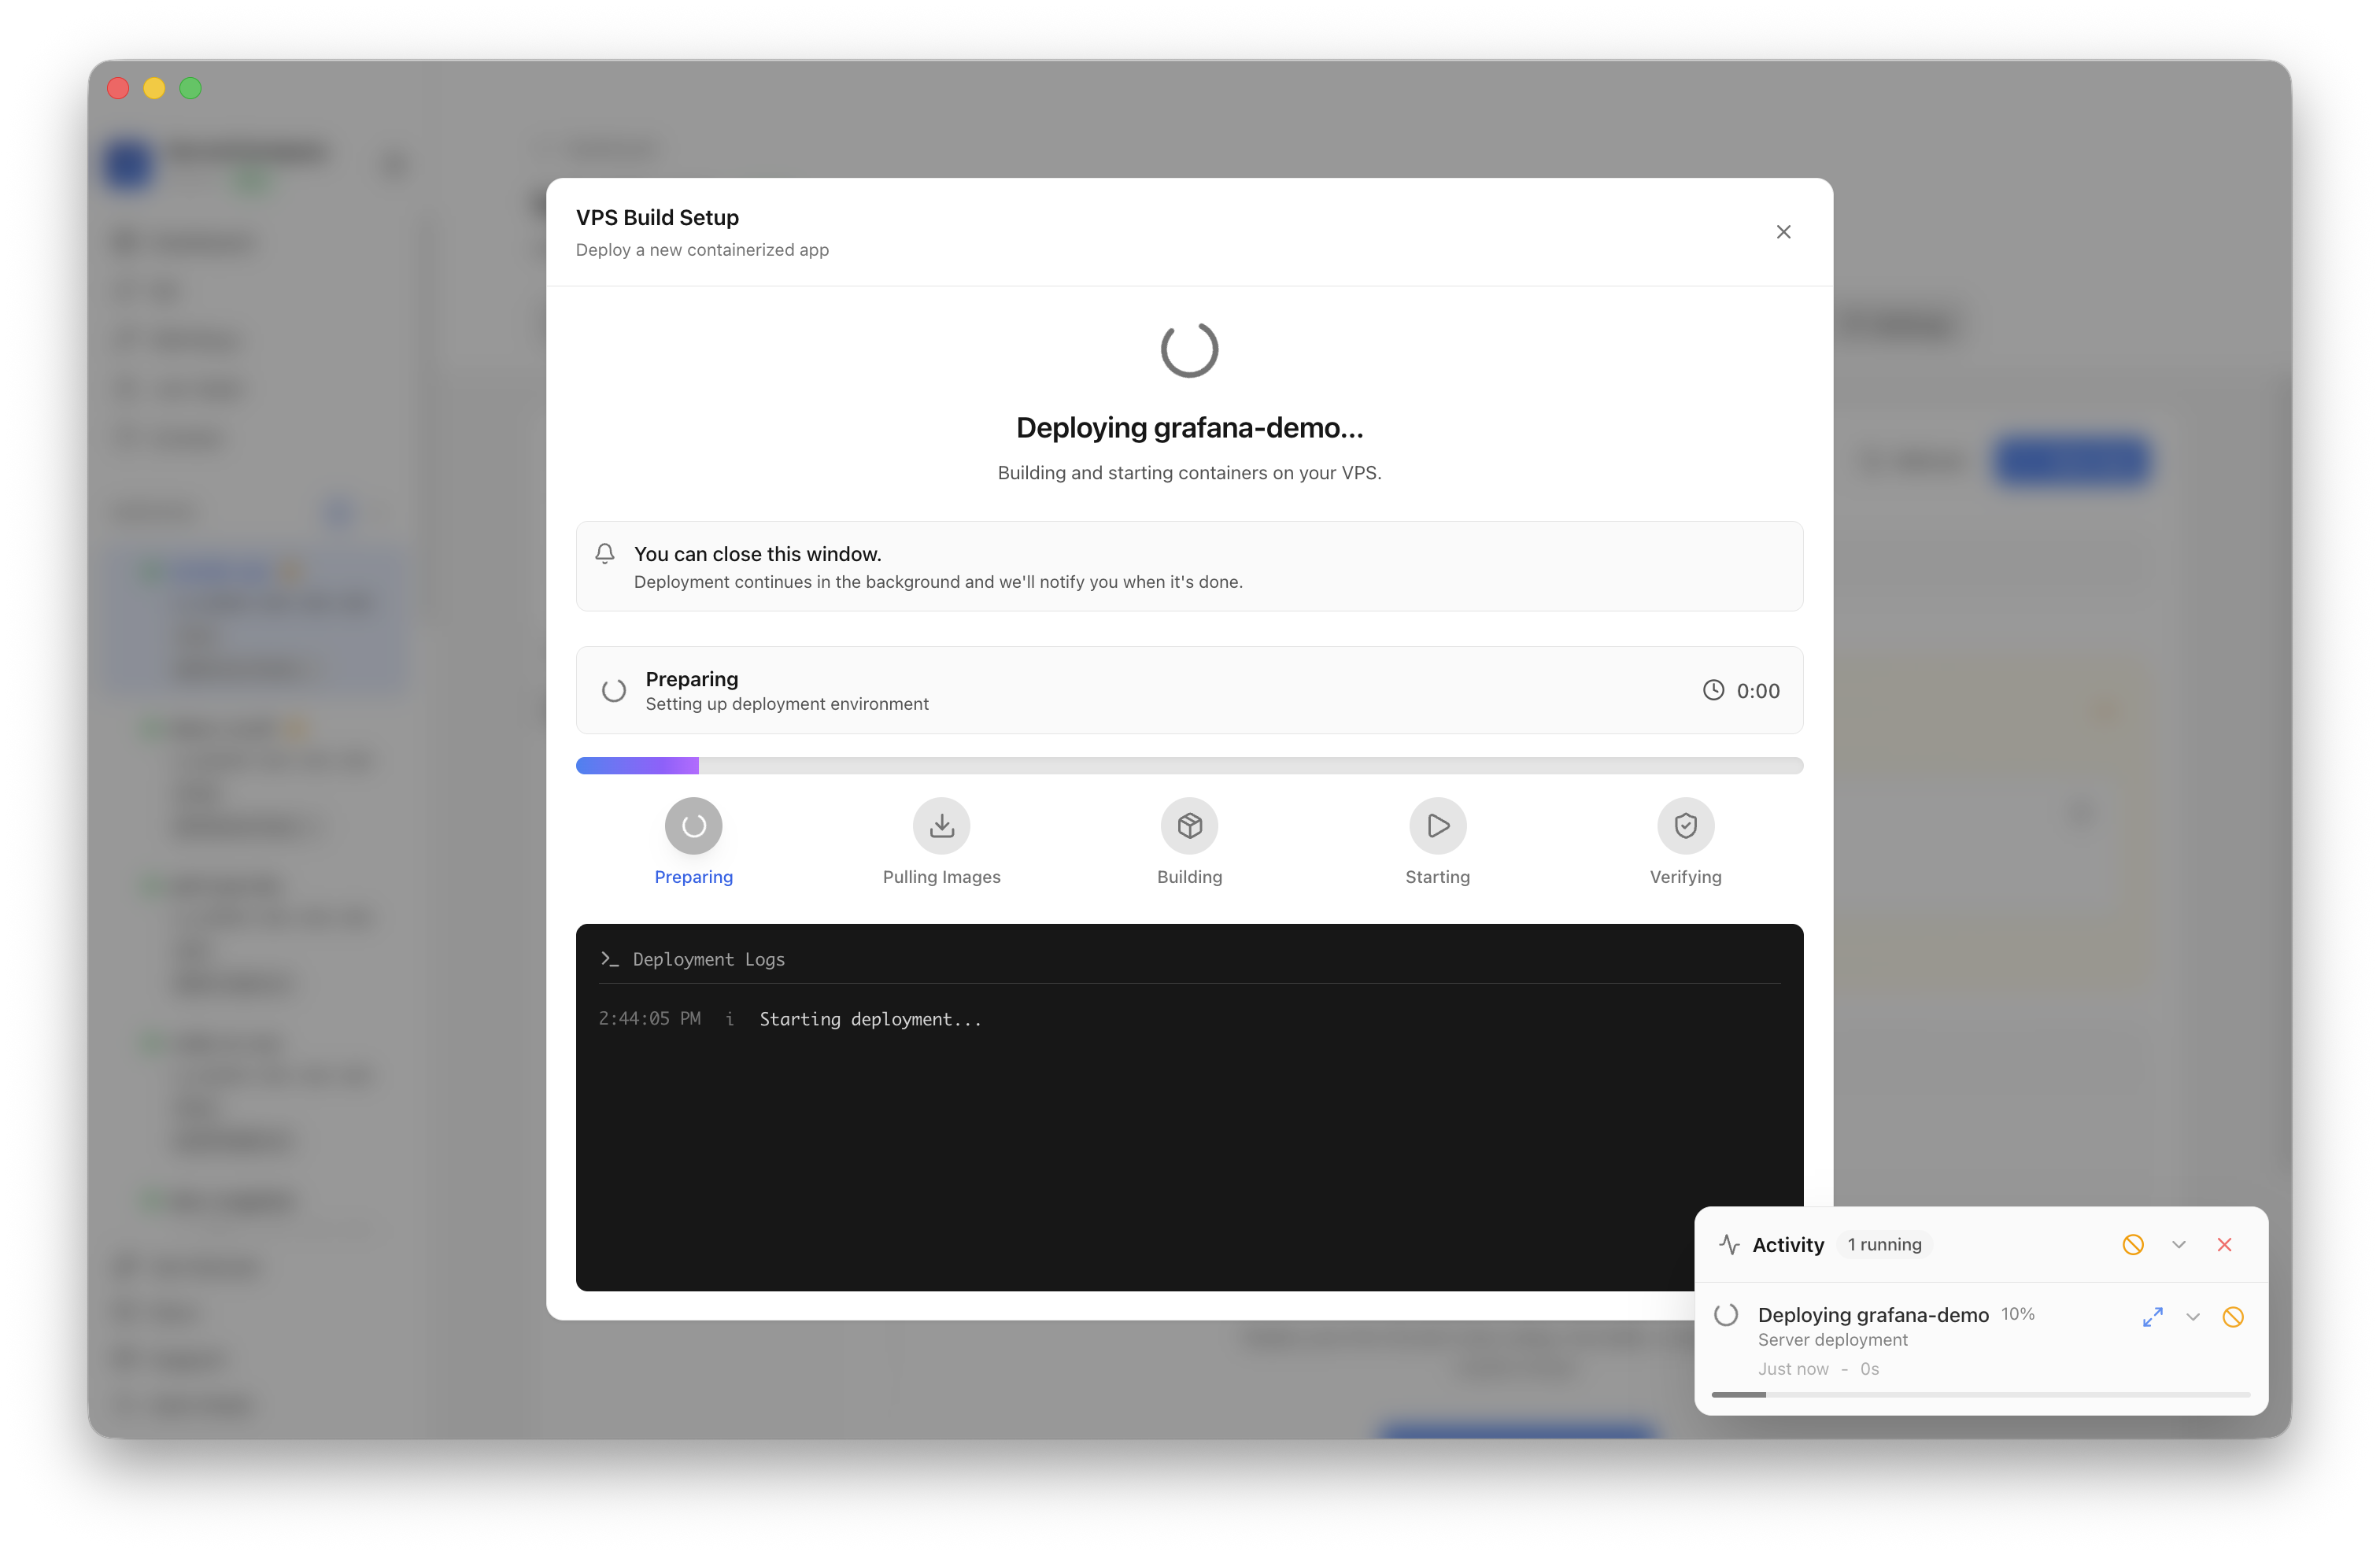
Keep the deployment modal open while Server Compass prepares the server, installs Docker if needed, pulls the Grafana image, starts the container, and verifies the service.
After deployment finishes, return to the Apps tab and confirm Grafana is marked Running. The app card keeps the URL and generated login credentials available.
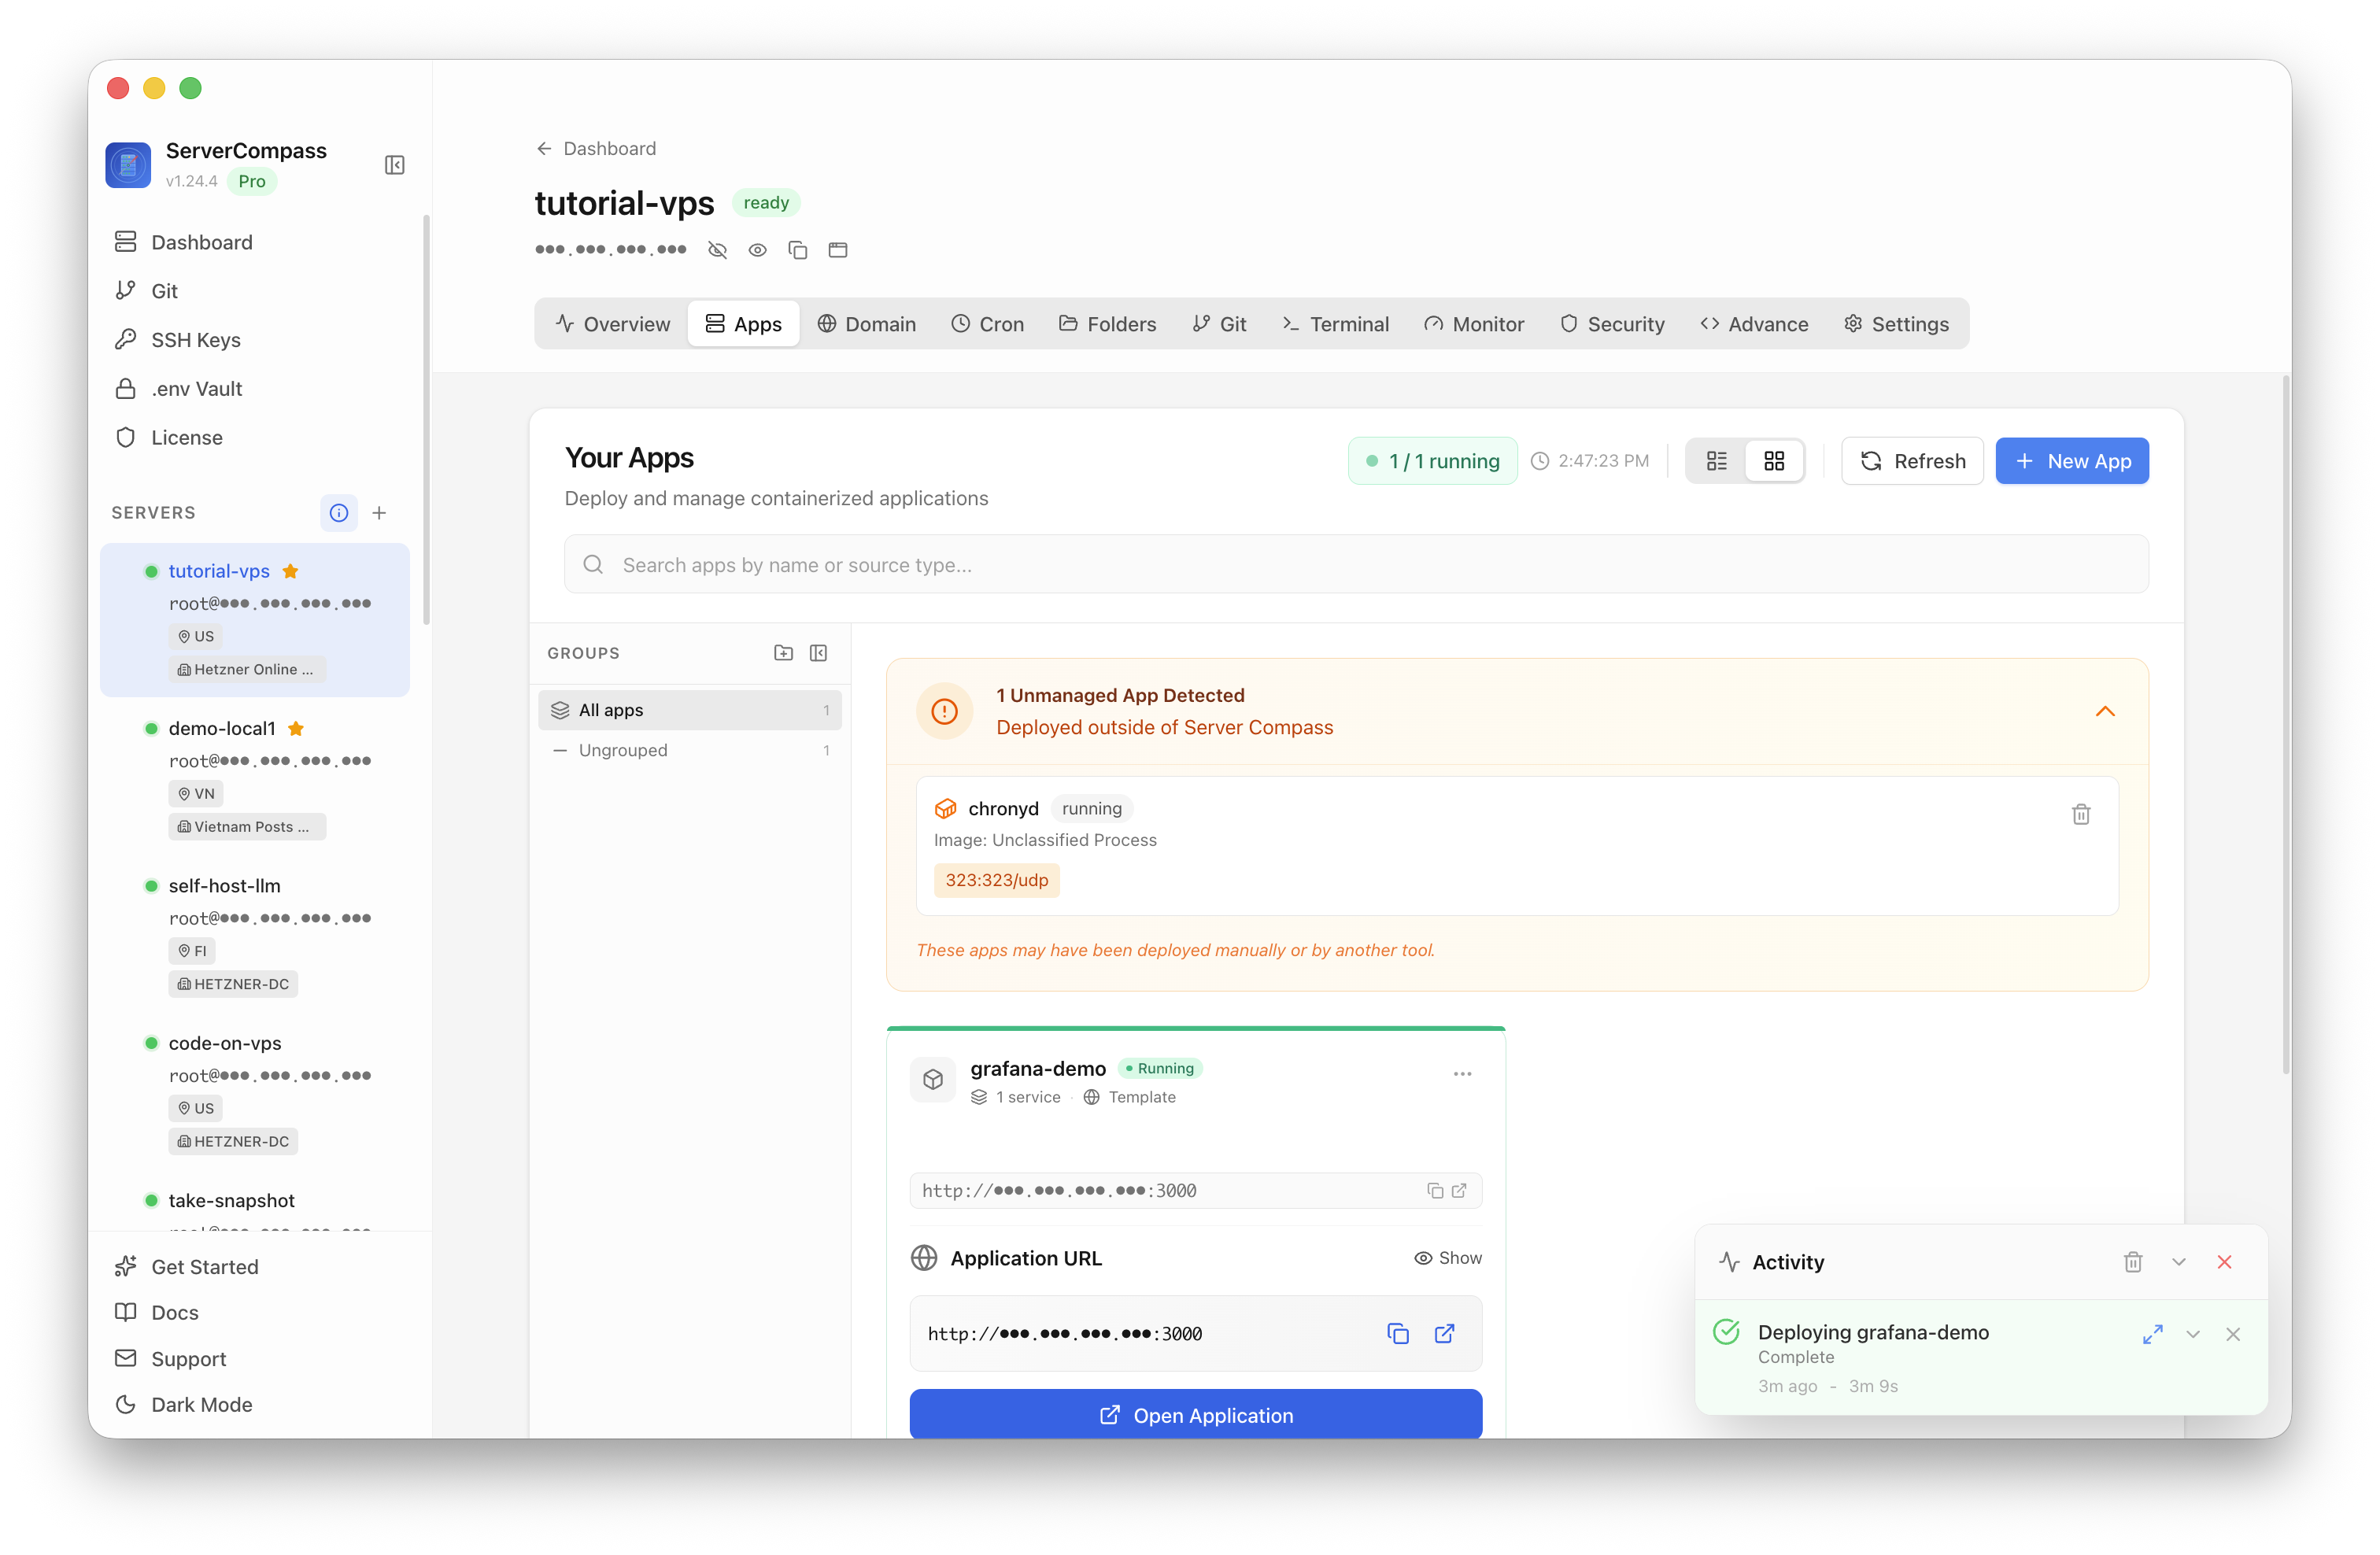
Click Open Application or open the application URL in a browser. The Grafana login screen confirms the service is reachable and ready for setup.
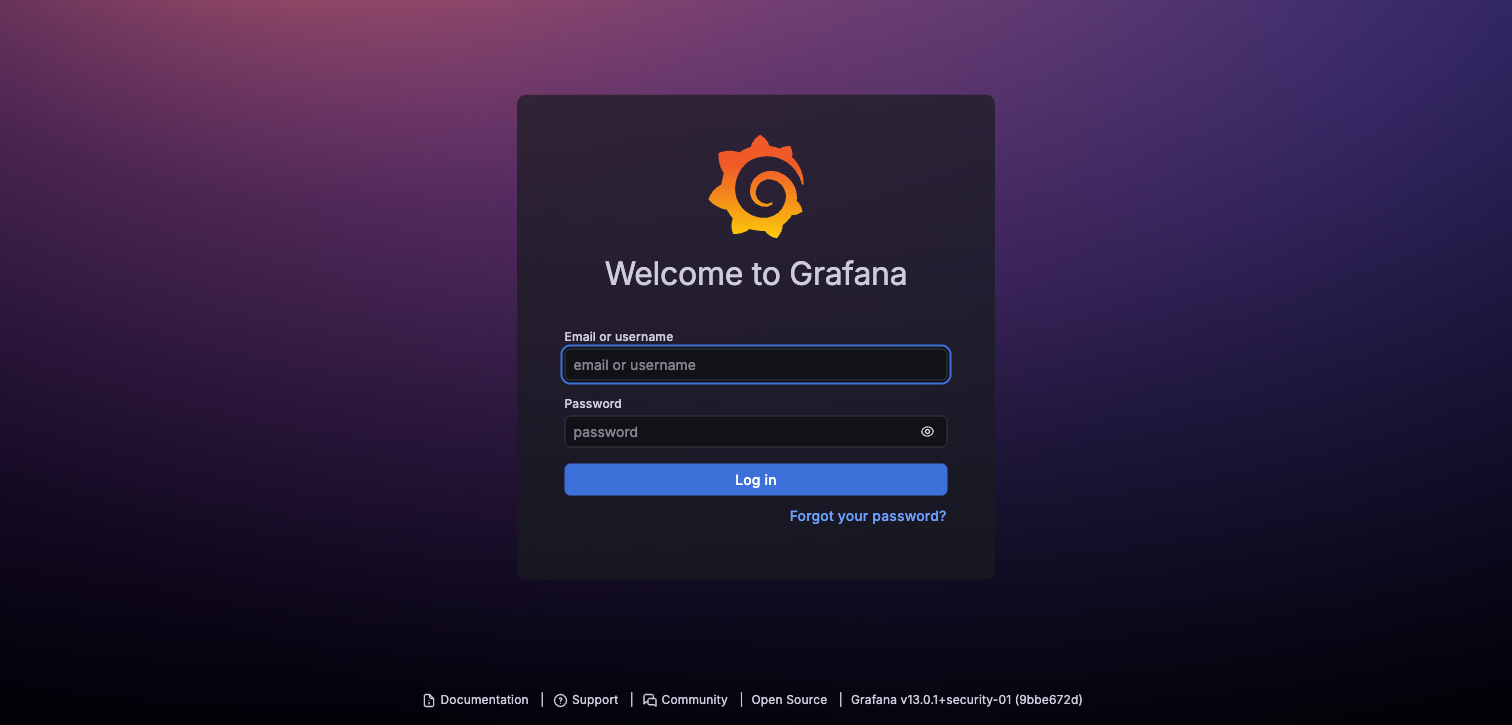
The browser loaded Grafana successfully. The root URL returned HTTP 302 to /login, and the login page rendered with title Grafana.
It deploys the official Grafana Docker image, a persistent Grafana data volume, generated admin credentials, and the default Grafana web port.
The pilot used host port 3000, which maps to Grafana's default container port.
A fresh Grafana deployment starts at the login screen. Seeing that page confirms the container is running and reachable from a browser.
No. The deployment guide should live on the Grafana template detail page and be linked from the reusable template deployment docs page.
Deploy Grafana the traditional way with SSH and Docker Compose.
Launch your preferred terminal and connect to your VPS using SSH.
# Log into your server
ssh root@<your-server-ip>

# If using key-based auth
ssh -i ~/.ssh/my-key root@<your-server-ip>
First time? Docker not installed? Run: curl -fsSL https://get.docker.com | sh
Prepare a directory for your application files and configuration.
# Create and navigate to project directory
mkdir -p ~/apps/grafana
cd ~/apps/grafanaCreate the Docker Compose configuration file with these contents:
services:
  grafana:
    image: grafana/grafana:latest
    ports:
      - "3000:3000"
    environment:
      - GF_SECURITY_ADMIN_USER=admin
      - GF_SECURITY_ADMIN_PASSWORD=<your-admin-password>
      - GF_USERS_ALLOW_SIGN_UP=false
    volumes:
      - grafana_data:/var/lib/grafana
    restart: unless-stopped

volumes:
  grafana_data:
PORTHost port(default: 3000)ADMIN_USERAdmin user(default: admin)ADMIN_PASSWORDAdmin passwordLaunch the application stack using Docker Compose.
# Deploy the application
docker compose up -d

# Check container health
docker compose ps

# Monitor logs
docker compose logs -f --tail=100Enable external access by opening the necessary port.
# Allow the application port through firewall
sudo ufw allow 3000/tcp
sudo ufw reload

# Access your app at:
# http://your-server-ip:3000Server Compass makes deploying Grafana effortless. Visual setup, one-click deploy, done.
After deploying Grafana with Server Compass, complete these steps to finish setup
Log in with admin credentials
Add data sources (Prometheus, InfluxDB, etc.)
Create dashboards
Need help? Check out our documentation for detailed guides.
Common questions about self-hosting Grafana
Simply download Server Compass, connect to your VPS, and select Grafana from the templates list. Fill in the required configuration and click Deploy. The entire process takes under 3 minutes.
Grafana requires a minimum of 256MB RAM. We recommend a VPS with at least 1024MB RAM for optimal performance. Any modern Linux server with Docker support will work.
Yes! Server Compass provides volume mapping that allows you to import existing data. You can also use standard Grafana backup and restore procedures.
Server Compass makes updates easy. Simply click the Update button in your deployment dashboard, and the latest Grafana image will be pulled and deployed with zero downtime.
Grafana is open-source software. You only pay for your VPS hosting (typically $5-20/month) and optionally Server Compass ($29 one-time). No subscription fees or per-seat pricing.
Download Server Compass and deploy Grafana to your VPS in under 3 minutes. No Docker expertise required.
Download Server Compass