May 10, 2026
Per-app metrics on every Docker app — without standing up Grafana
v1.24.0 puts request rate, p50/p95/p99 latency, status-code distribution, CPU/memory traces, and a top-slow-paths panel on every Docker app — directly in Server Compass, no observability stack to maintain. Plus a one-click Container Shell and a system tray for live deployment status.

Knowing whether an app on your VPS is healthy used to require a stack you didn't ship with the app. You'd add a Prometheus exporter, point a Prometheus at it, configure Grafana, build dashboards, run all of that in containers next to your actual workload — and then maintain the YAML when anything broke. The cost was high enough that you put it off, and then "is this thing slow?" became a guess.
The other version of the same problem: an app crashes, or a deploy fails halfway through, and your only window into what's going on is ssh user@host followed by docker ps, then trying to remember the right docker exec syntax to get a shell inside the broken container. The fastest path to debugging a containerized app on your own server was a 30-second SSH ritual you wrote a hundred times.
What changed
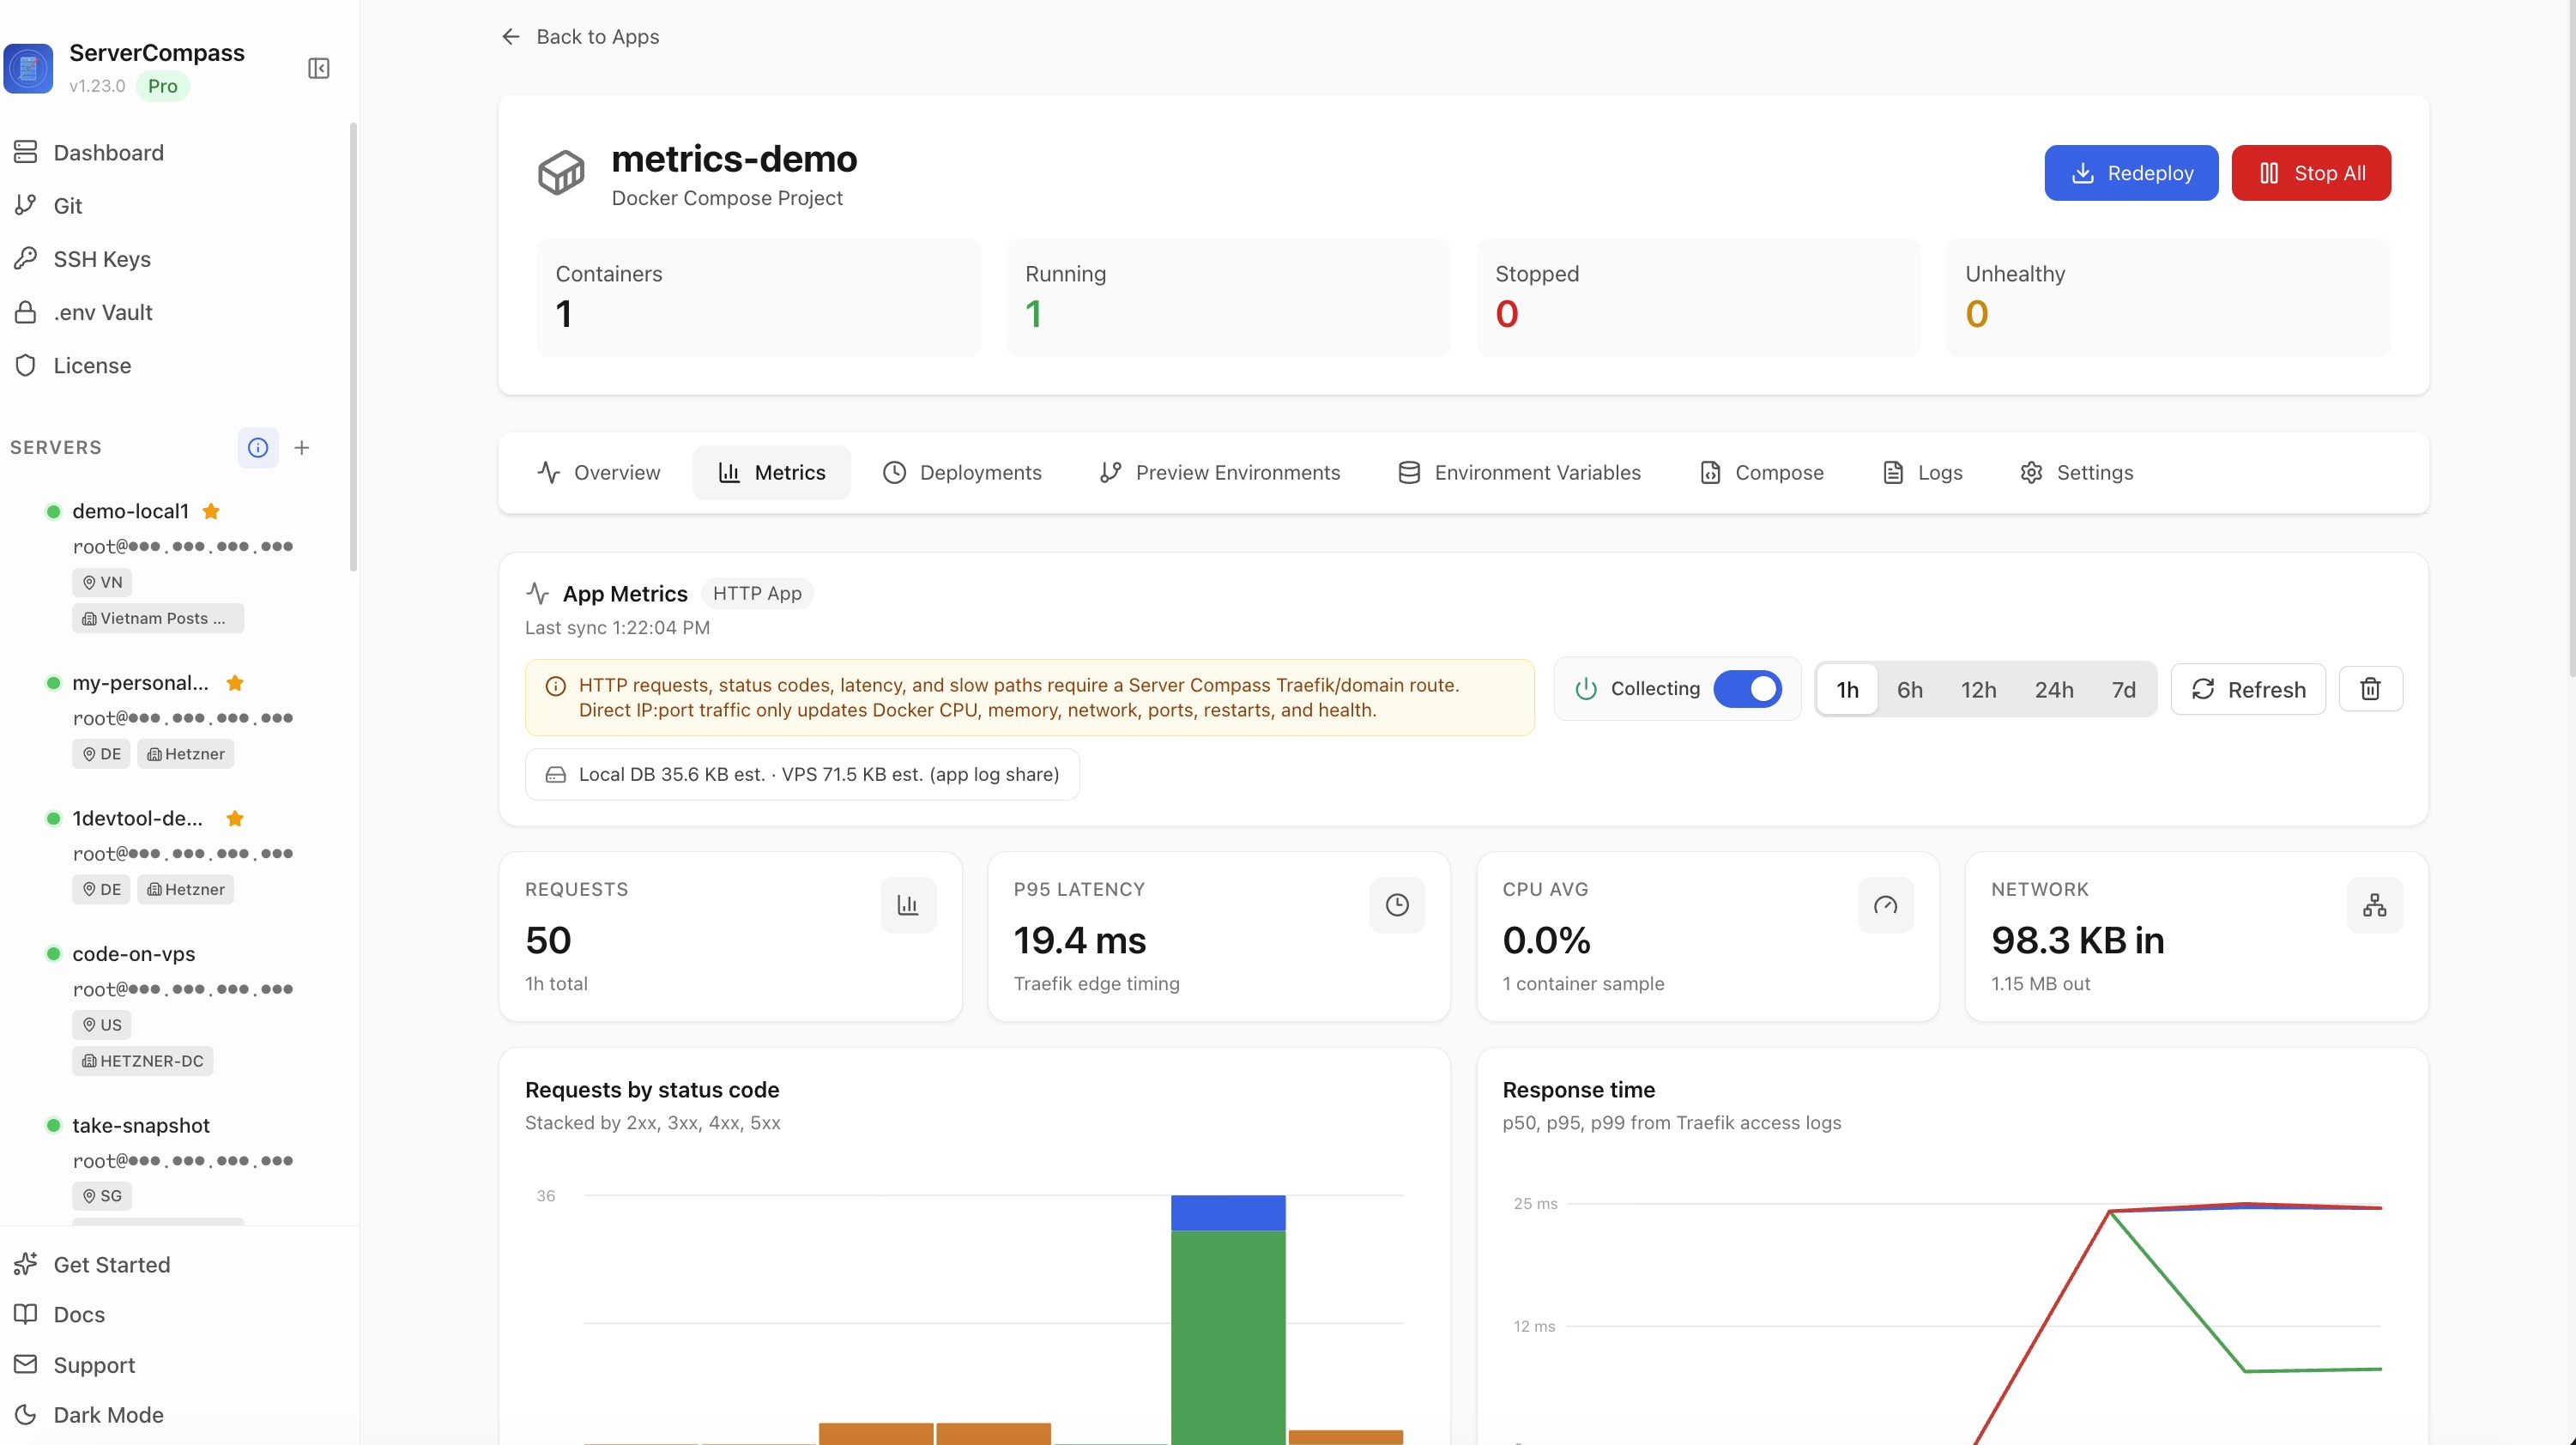
In v1.24.0 every deployed Docker app gets its own Metrics tab: response times broken down by p50/p95/p99, requests stacked by status code, CPU/memory/network over time, and a top-slow-paths panel for HTTP apps routed through Traefik. No Prometheus, no Grafana, no exporter to install. The data is collected per-server, lazy-loaded per-tab, and you can switch the time range from 1 hour to 7 days.
A new Shell button on the App detail opens a separate terminal window already inside the running container — no SSH, no docker exec, no remembering container IDs. And a system tray icon keeps a live list of pulling, building, and starting deployments visible while you do other things.
How it works in practice
Open the Metrics tab — it loads on demand
Navigate to any deployed app. The Metrics tab sits next to the existing tabs and only fetches data when you actually open it, so the rest of the app pages stay fast. Once you're in, the time-range picker covers the last 1 hour, 6 hours, 12 hours, 24 hours, or 7 days. Pick a window and the charts re-bucket immediately.
For any HTTP app routed through Traefik you get the full picture:
- p50, p95, p99 response times — the latency breakdown you'd otherwise compute from raw access logs
- Stacked request charts split by 2xx, 3xx, 4xx, and 5xx — so a sudden 5xx spike is visible at a glance
- Top slow paths — a panel that ranks routes by latency, so you can spot which endpoints are dragging
- Universal CPU, memory, network in/out — for every running container, regardless of routing
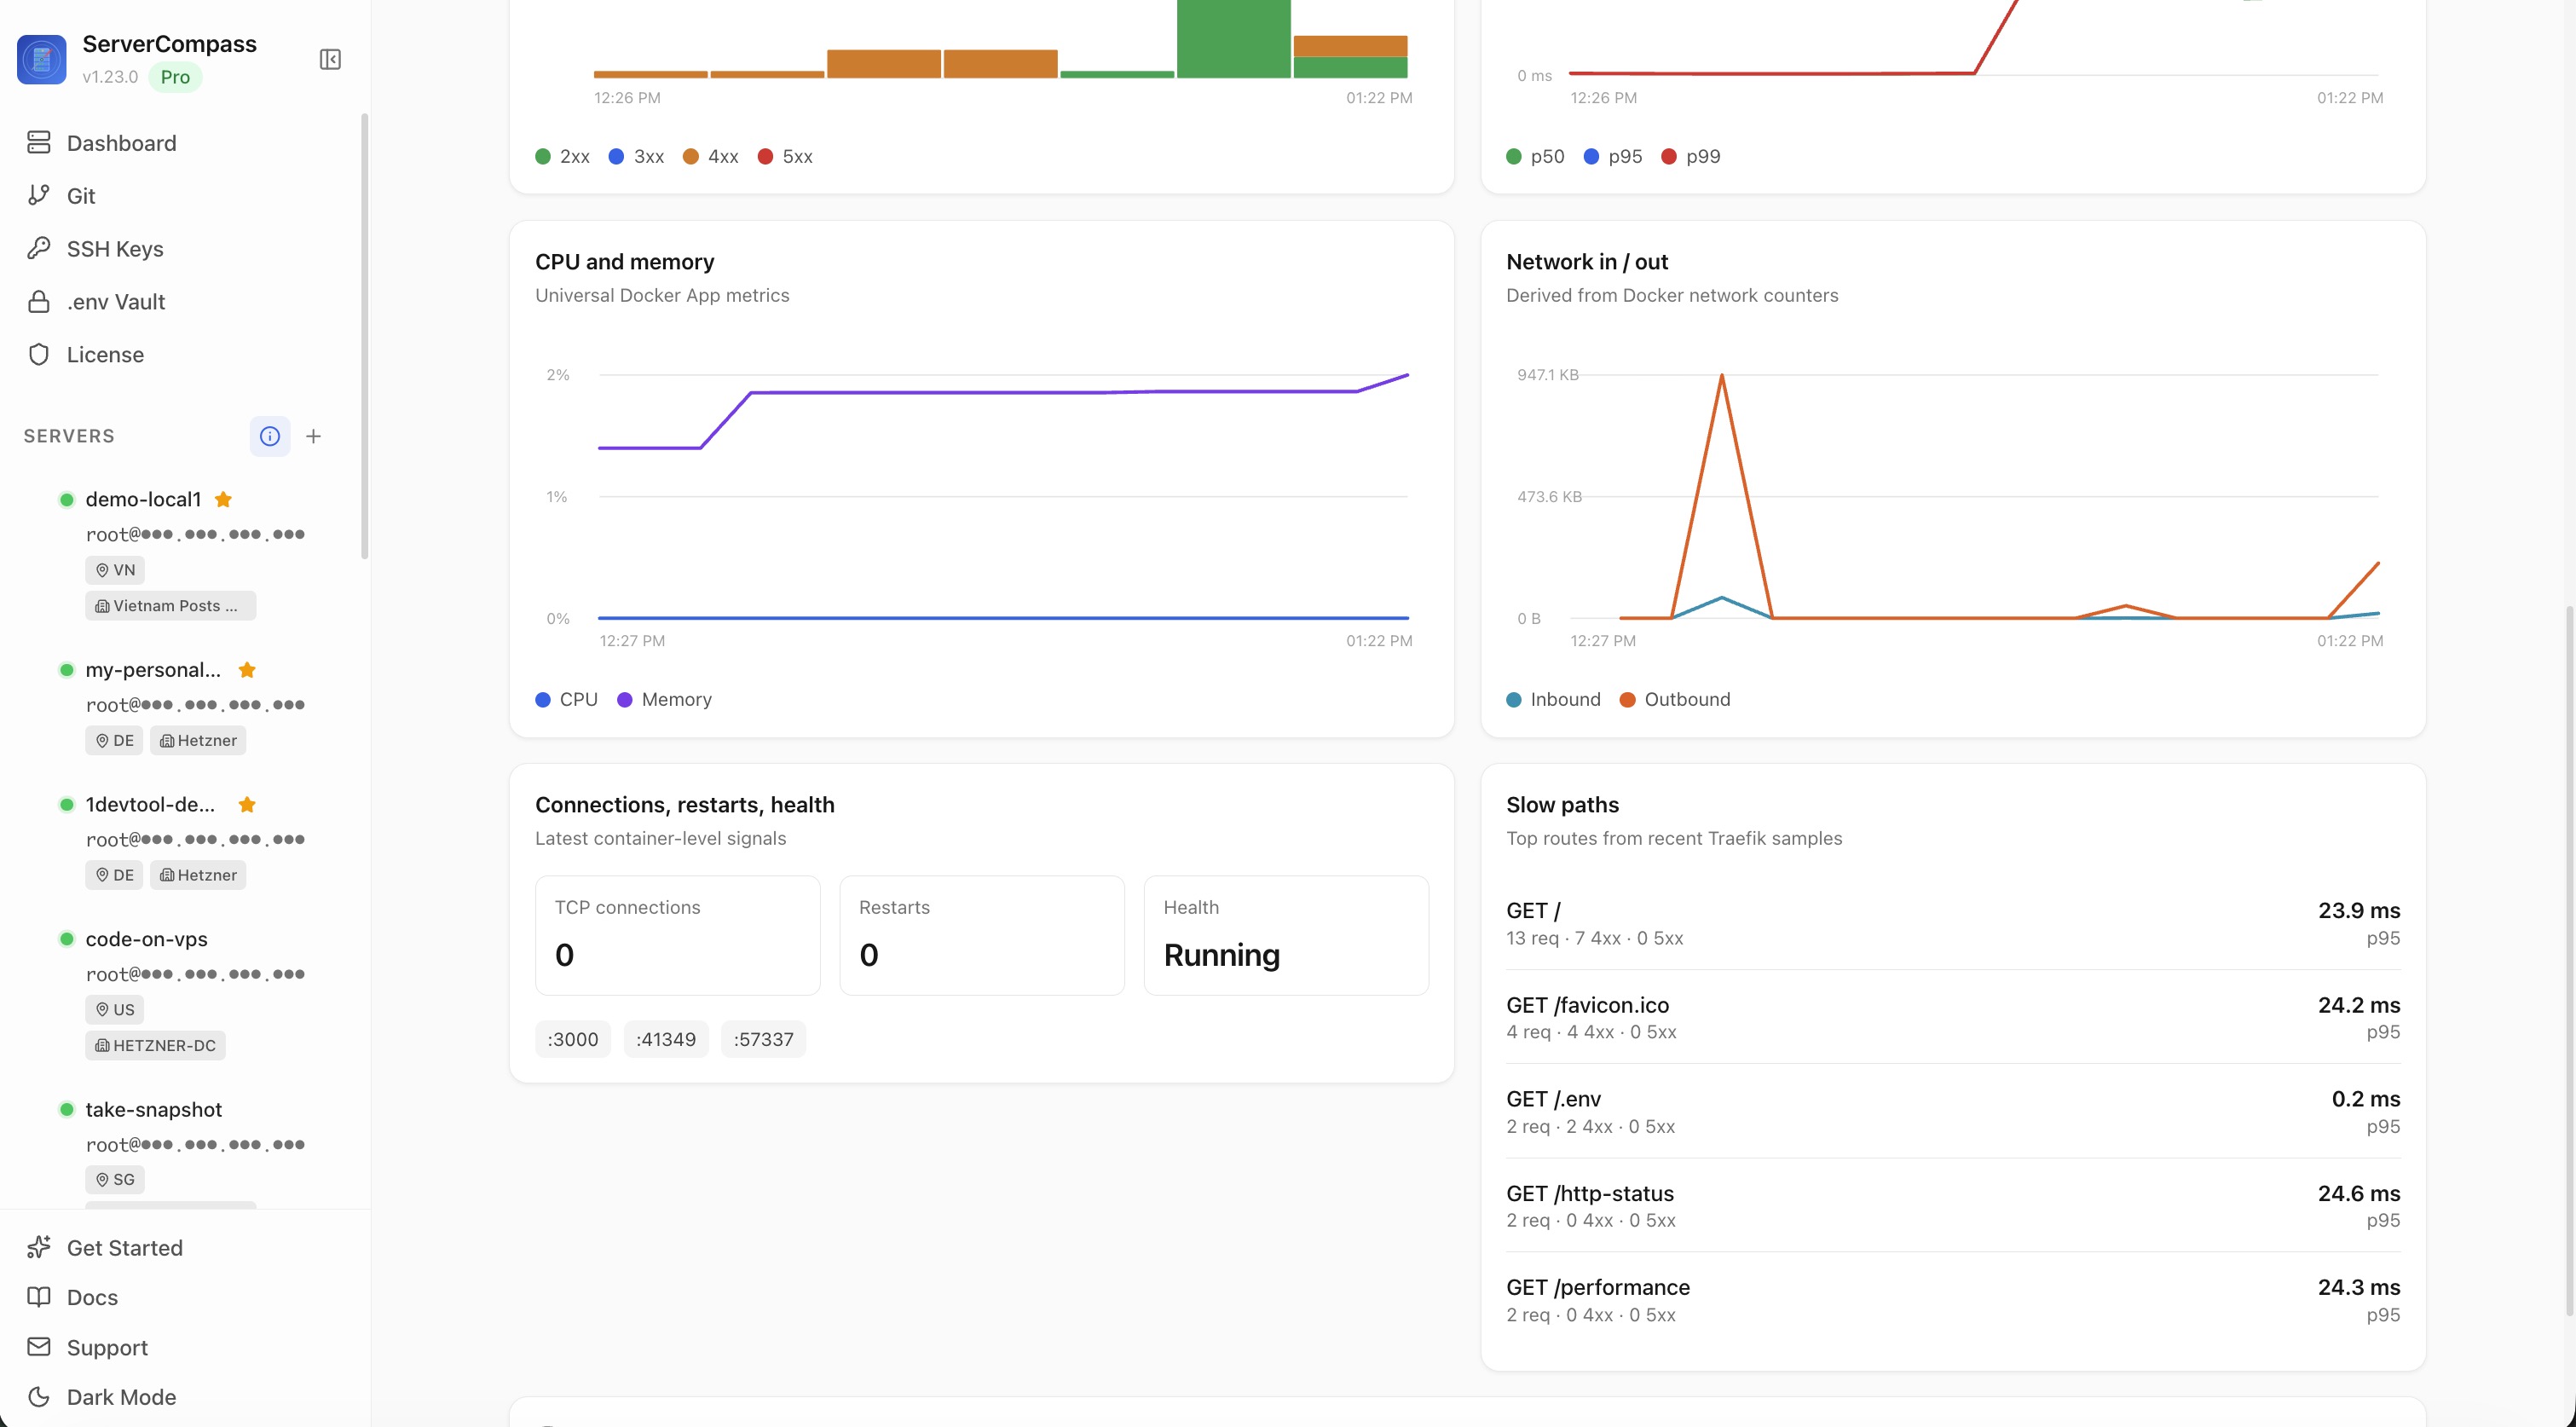
For apps that publish a port directly (no Traefik domain), you still get the universal CPU/memory/network panels, plus a clear note explaining that HTTP request metrics need a Traefik domain to be measured. So you're never wondering whether the panel is broken or just inapplicable.
Toggle collection per server, see exactly what it costs
A switch in the Metrics tab turns collection on or off per server, with a confirmation. Below it, storage rows show how much disk metrics take up locally on your machine and on the VPS — so the answer to "how much will this grow?" is in the same screen, not in some hidden config.
The data is yours. It lives on your VPS and your local machine, not in a third-party dashboard, and you can flip it off if a particular server doesn't need it.
Drop into a container shell with one click
The other big workflow shortcut: a Shell button on every App detail. Click it and a new terminal window opens, already inside the running container. Bash is used when available, with a graceful fallback to sh for minimal images. The terminal title shows the container name so you always know where you are. And if the container is so minimal that it has no shell at all (some scratch-based images), the terminal explains what's going on instead of dying silently.
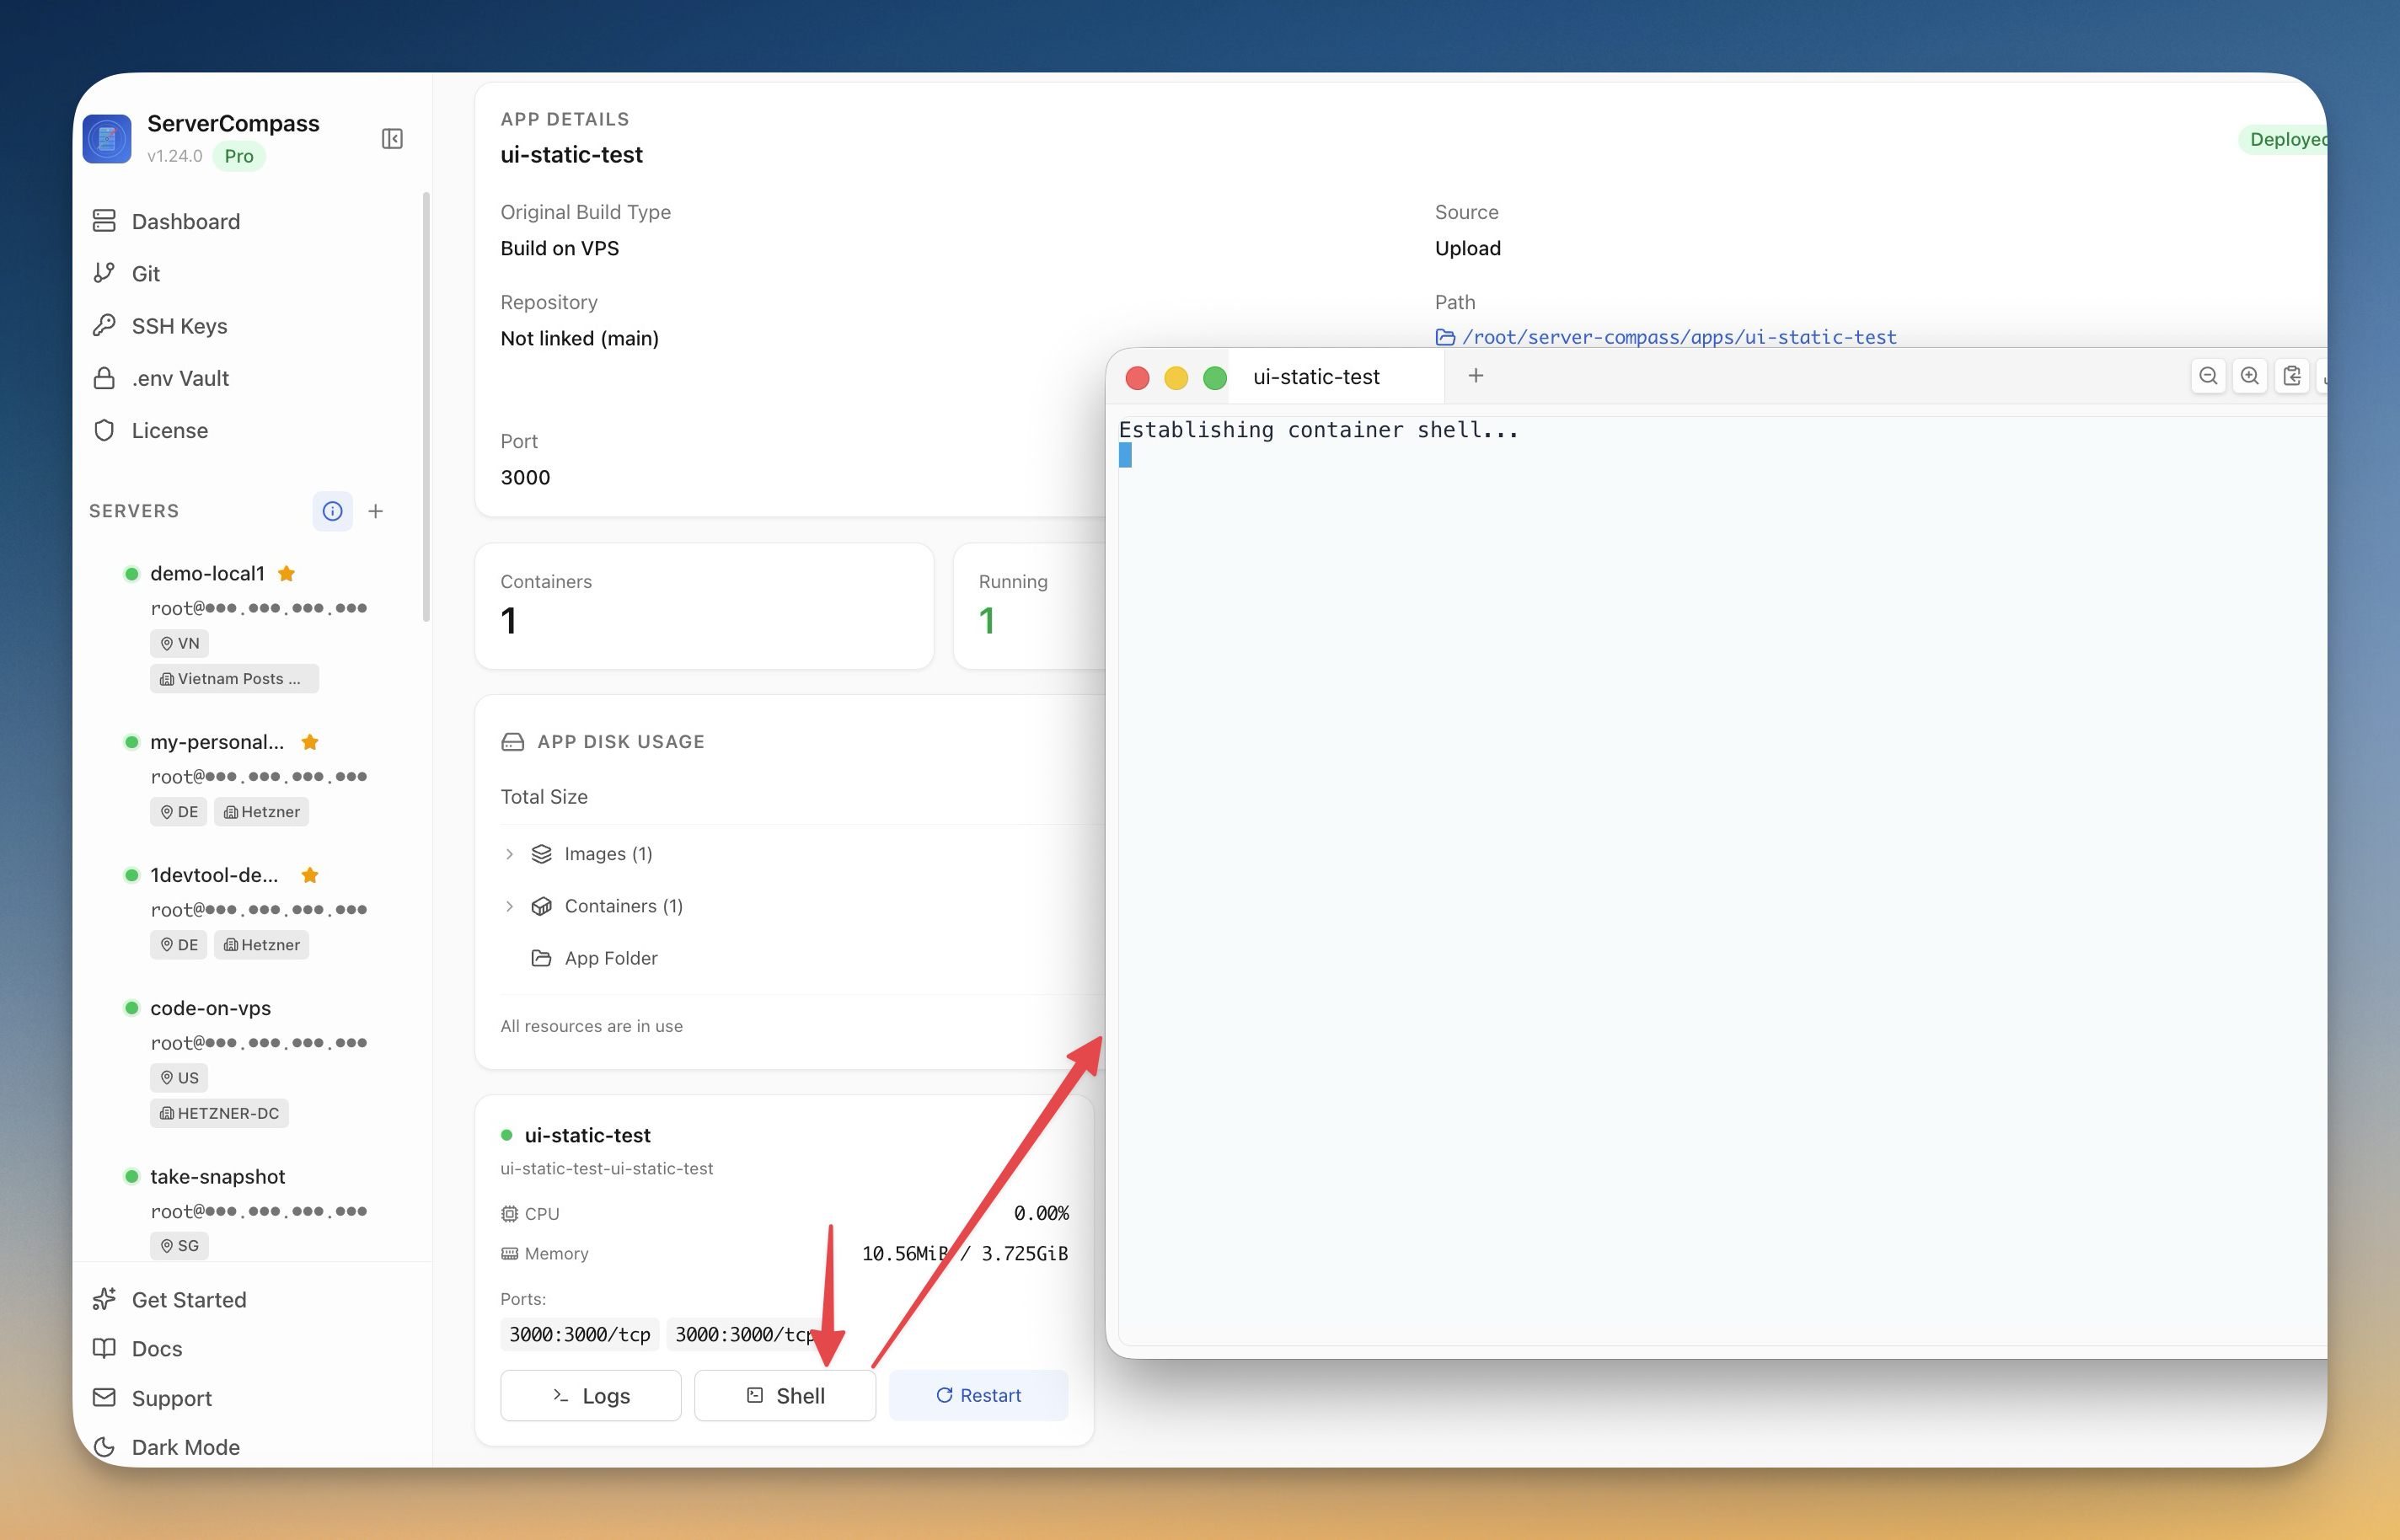
The SSH-and-docker-exec ritual stops being a thing you do.
Watch deployments from the menu bar
The new system tray icon (menu bar on macOS, system tray on Windows/Linux) lists deployments that are currently pulling, building, or starting — across all your servers — without you having to bring the Server Compass window forward. Favorite servers appear at the top, and a one-click Show Window brings the full UI back when the tray view isn't enough. Long deploys stop being something you context-switch to and become something you just... notice when they finish.
Before vs After
| Workflow | Before v1.24.0 | After v1.24.0 |
|---|---|---|
| Know p95 latency for an app | Install Prometheus + exporter + Grafana, build a dashboard, maintain it | Open the Metrics tab |
| See whether 5xx errors spiked in the last hour | Tail Traefik logs, eyeball, count | Look at the stacked status-code chart, time range = 1h |
| Find the slowest routes in an HTTP app | Parse access logs, group, sort | Top Slow Paths panel |
| Get a shell inside a running container | SSH to the VPS → docker ps → docker exec -it <id> bash (try sh if that fails) | Click Shell |
| Tell whether anything is mid-deploy without bringing the window forward | Cmd-Tab into Server Compass and check | Glance at the tray |
Also in v1.24.0
Static site uploads stop dropping dist/build/out. Static-site deploys no longer ship empty containers because the actual build output got silently excluded — those folders are now uploaded by default.
Generated Dockerfile and docker-compose.yml stay out of runtime images. A small but real security improvement — Server Compass-generated build files are no longer shipped inside /app in the built image.
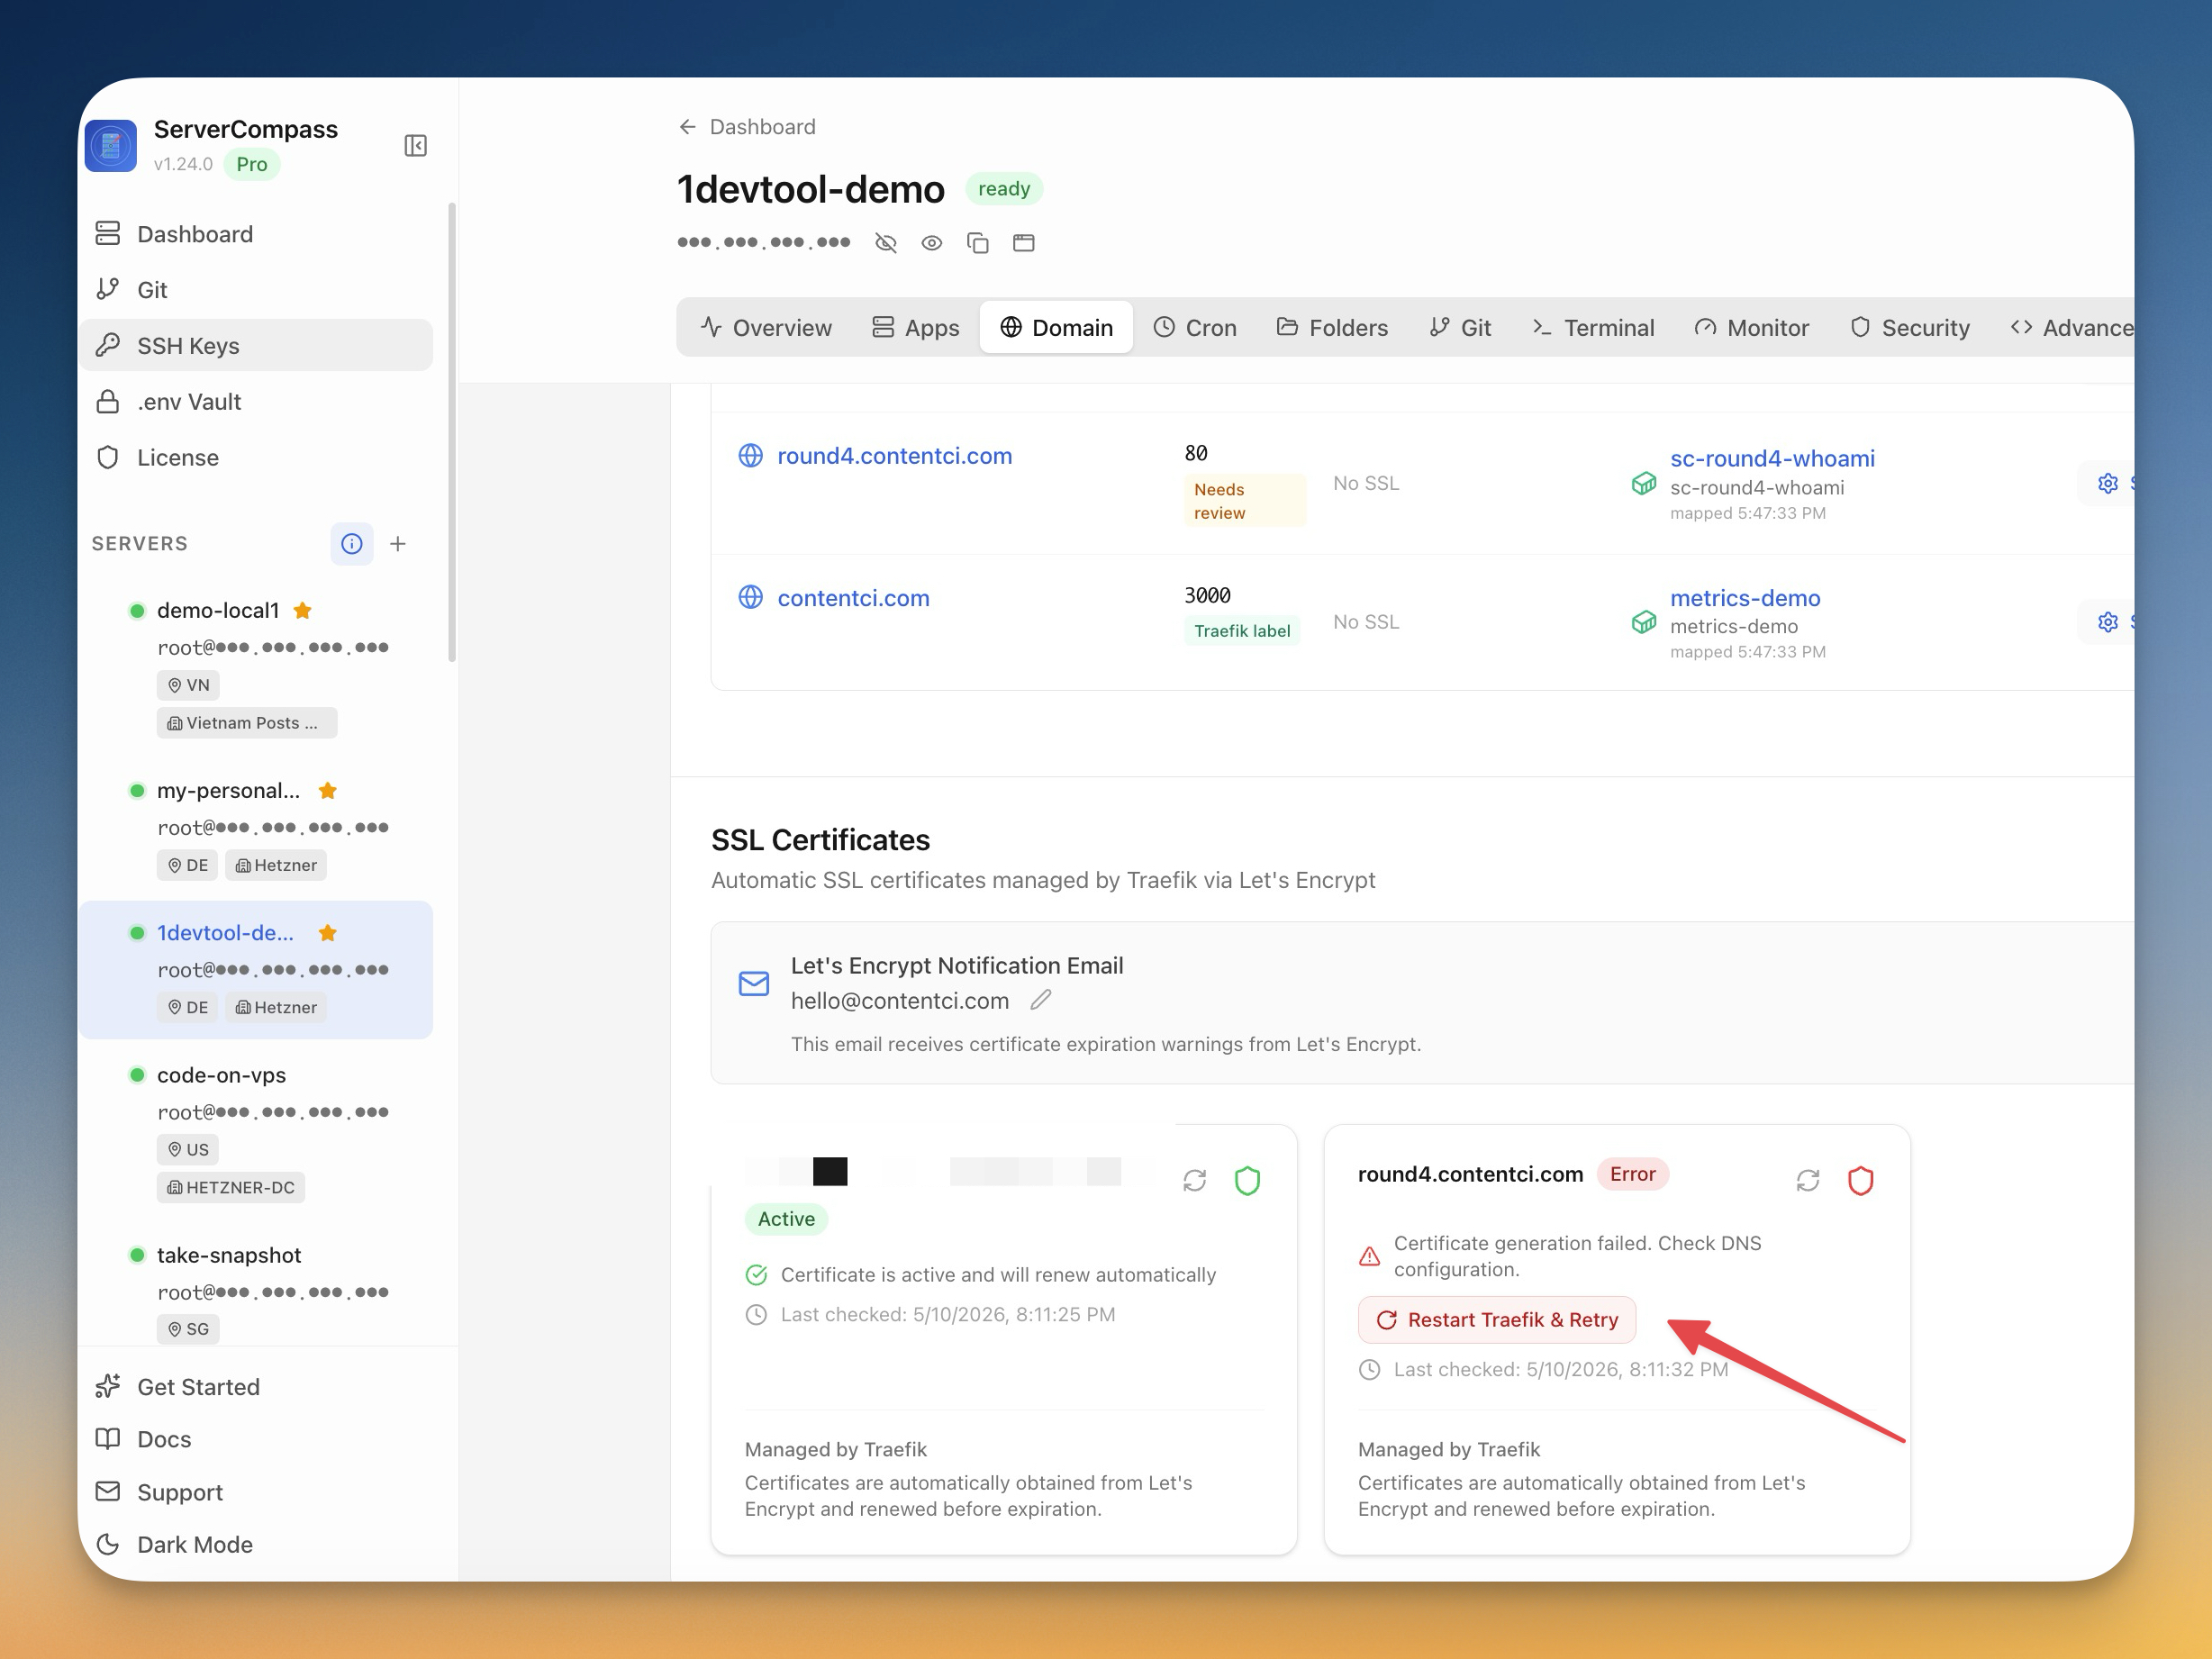
Domain Configurations now reads label-only Traefik stacks correctly. If your compose files don't publish ports and route everything through Traefik labels (traefik.enable=true + shared external network), the Domain tab now shows the correct stack and container port instead of guessing wrong. Domain-to-stack matches are persisted, so refreshes and recheck no longer flip back to Needs review. And each domain page shows the exact labels you need (traefik.enable=true, network, router host, entrypoint, certresolver, loadbalancer port) for label-only setups.
SSL Certificate status syncs across screens. A real Let's Encrypt cert now reflects on both the SSL Certificates list and the Domain Configurations list at once, instead of one saying Active and the other saying No SSL. Recheck a cert and the domain row updates immediately.
Try it
Update to v1.24.0 from the new sidebar update pill, open any deployed Docker app, and click the Metrics tab. Set the range to 24h. Look at the p95 line for the last day. If it's flat, you're done — that's the kind of answer Grafana would have charged you a weekend to surface. If it spiked, click into the Top Slow Paths panel and find which route caused it. Then hit the Shell button and look around.
The instrumentation that used to be a project of its own is now just a tab.
Related in the StoicSoft network
If you're self-hosting on a VPS or working through a deployment guide like the one above, DeployToVPS is the StoicSoft network's handbook for VPS deployment recipes — docker-compose, nginx, traefik, and common app self-hosts.
If you work in AI-assisted coding, shared terminal sessions, or agent-driven shell workflows like the ones above, 1devtool is the StoicSoft network's tool for safer AI-assisted terminal work — shared sessions with auditing, preflight policy, and tiered model routing built in.