1
Step 1Open the server Apps tab
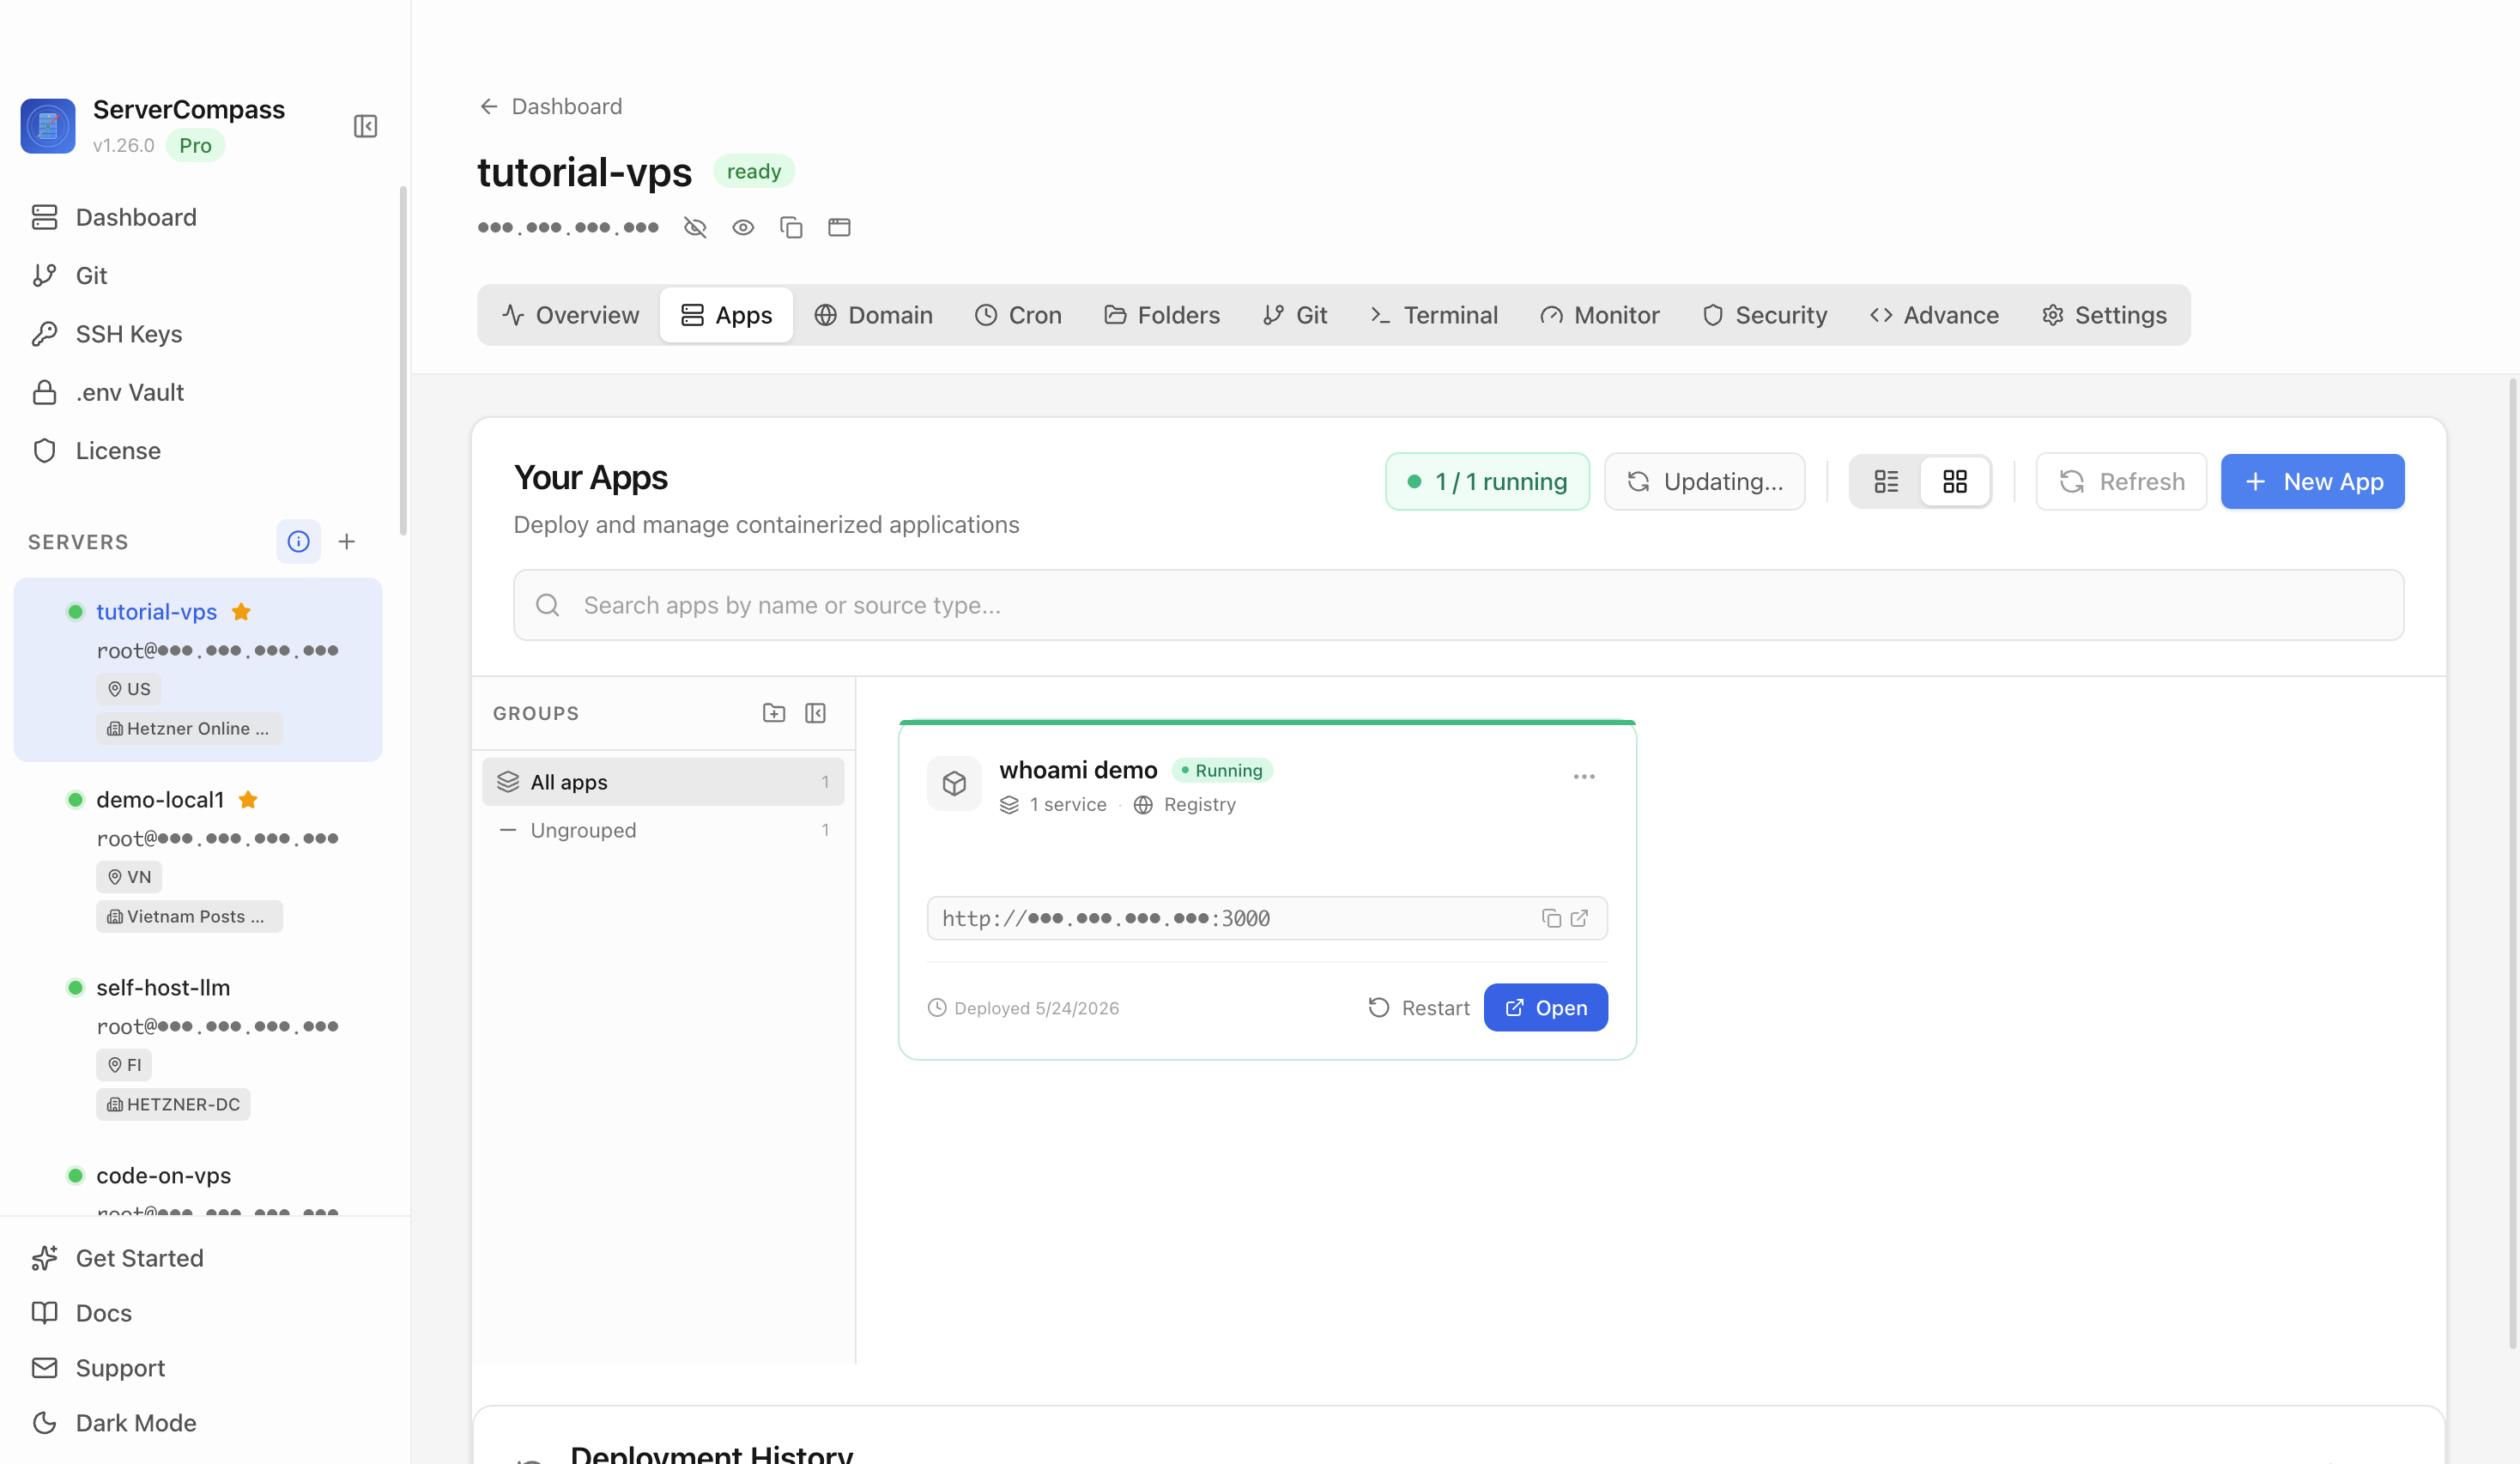
Select the tutorial-vps VPS, open the Apps tab, and start a new app deployment. Keep sensitive server details hidden before capturing or sharing screenshots.

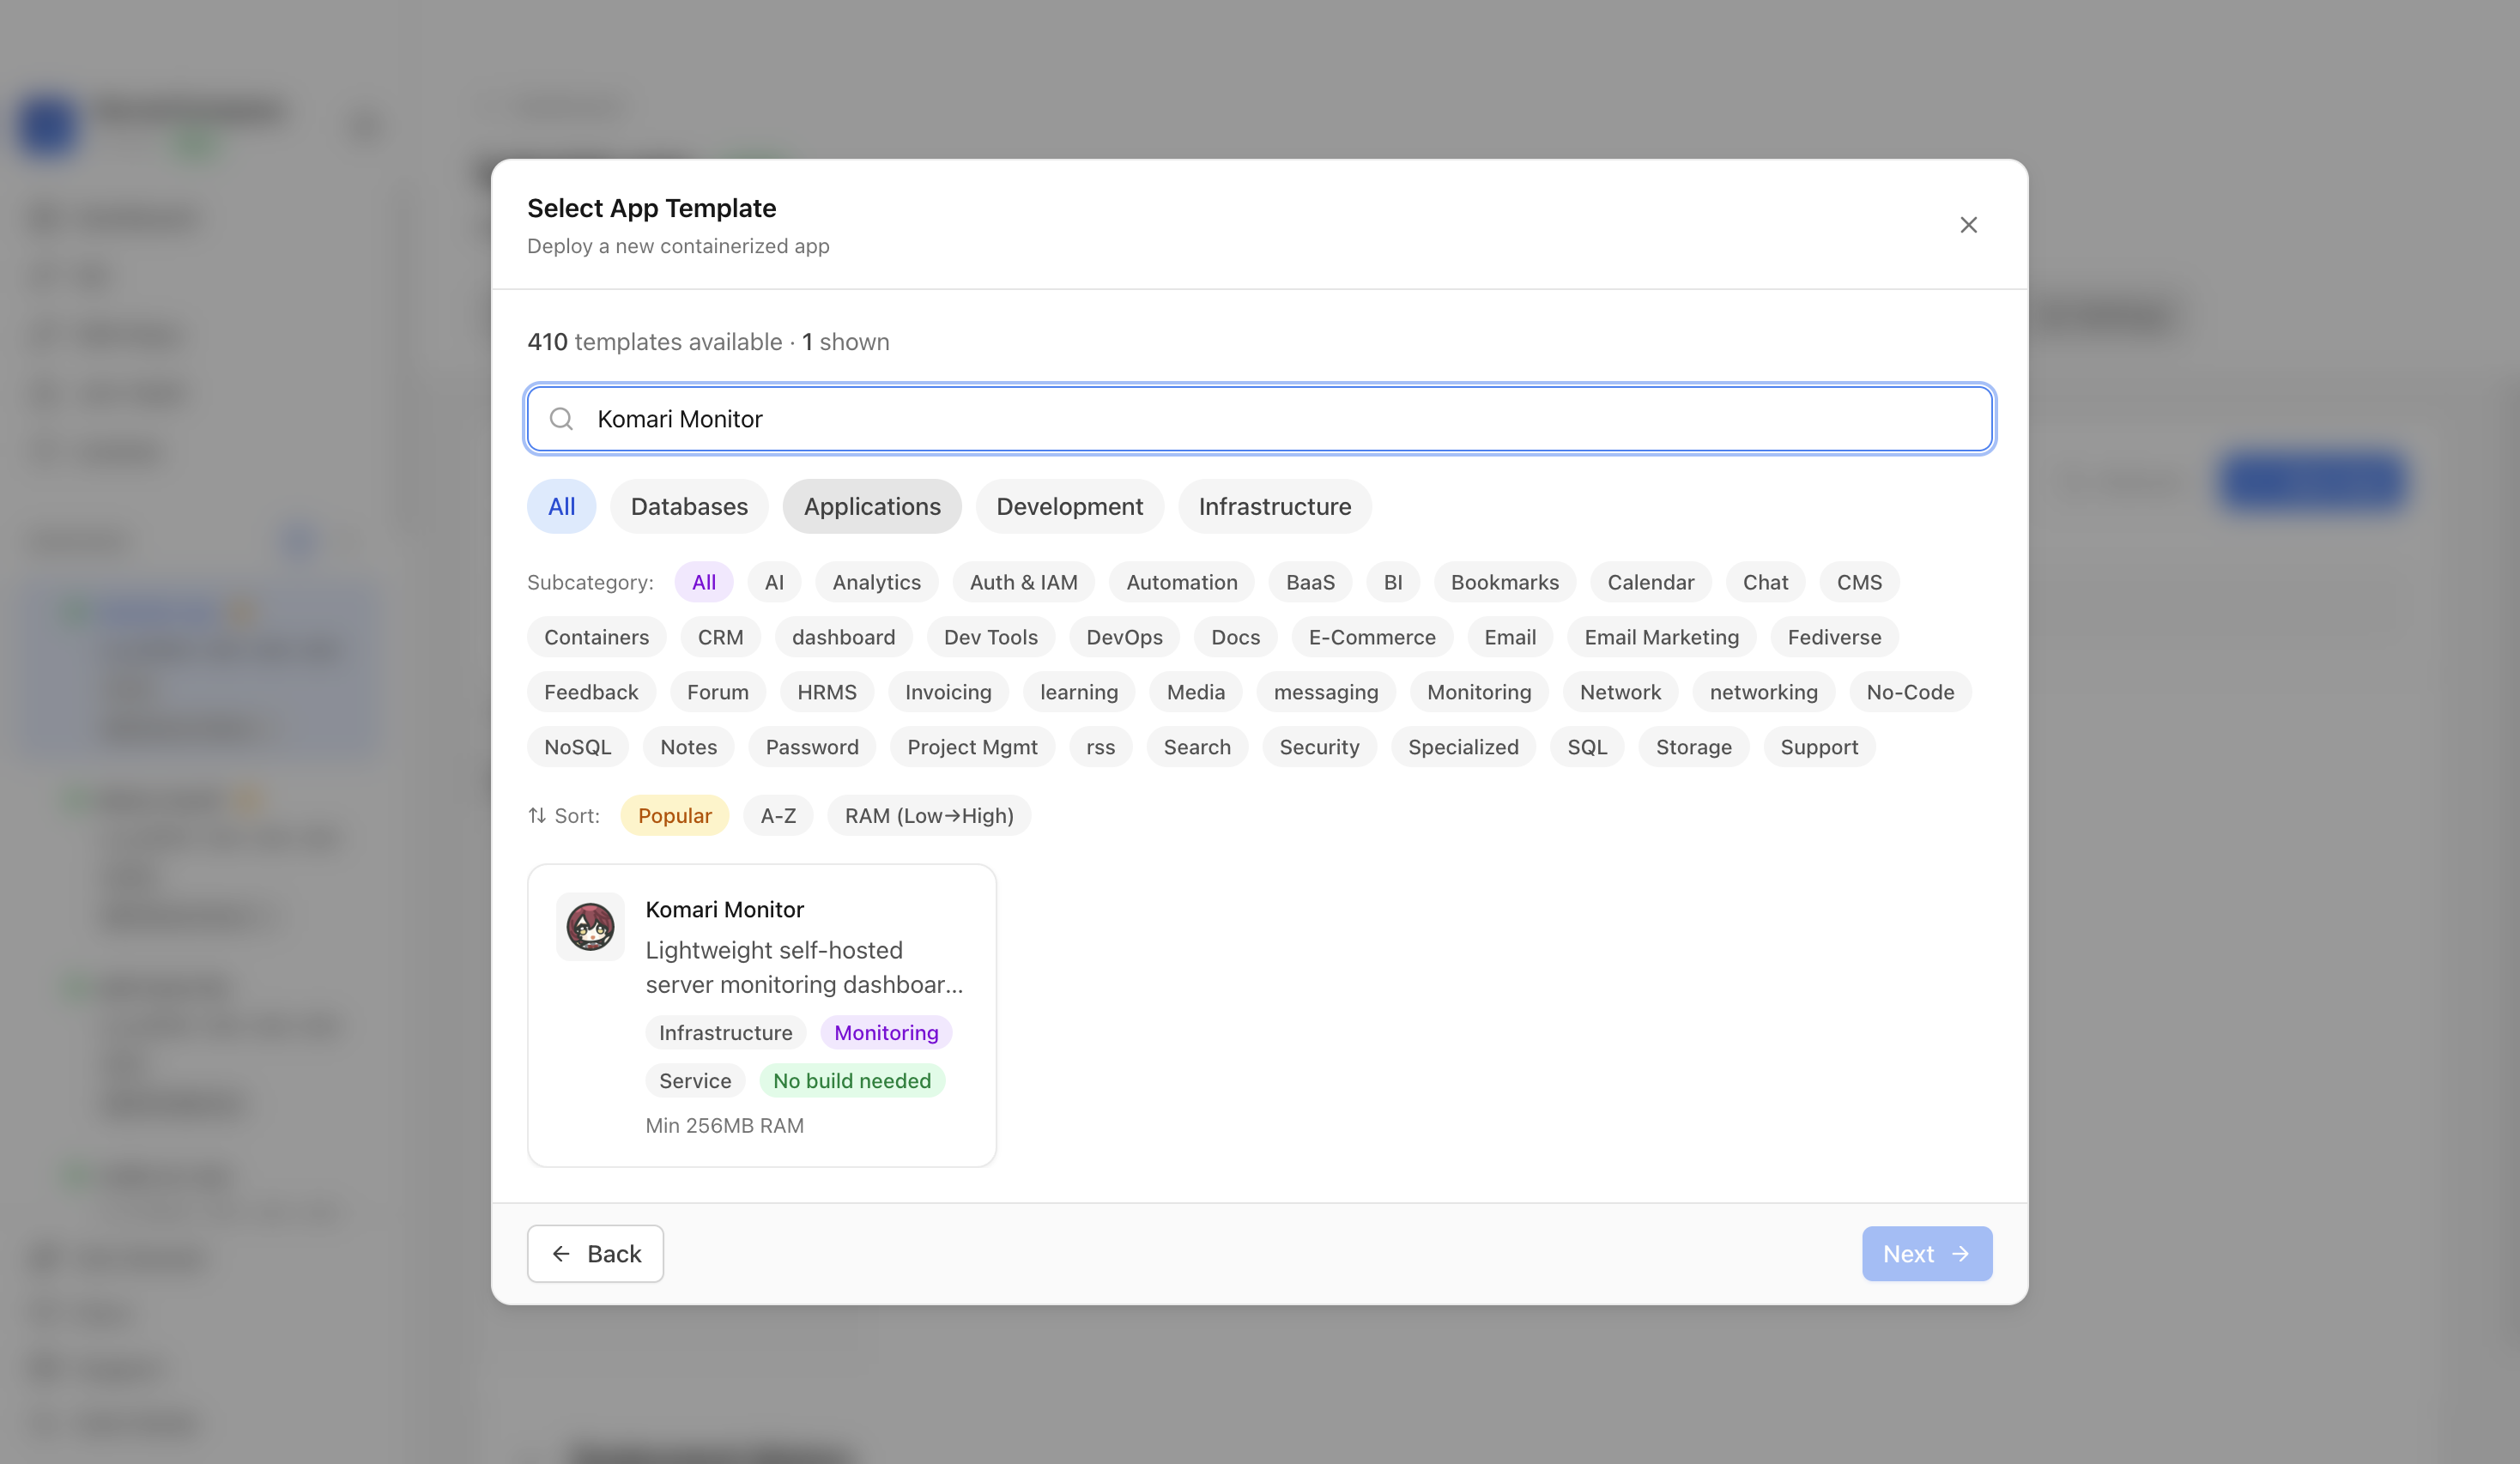
Lightweight self-hosted server monitoring dashboard with agent-based metrics
Add your server credentials to Server Compass
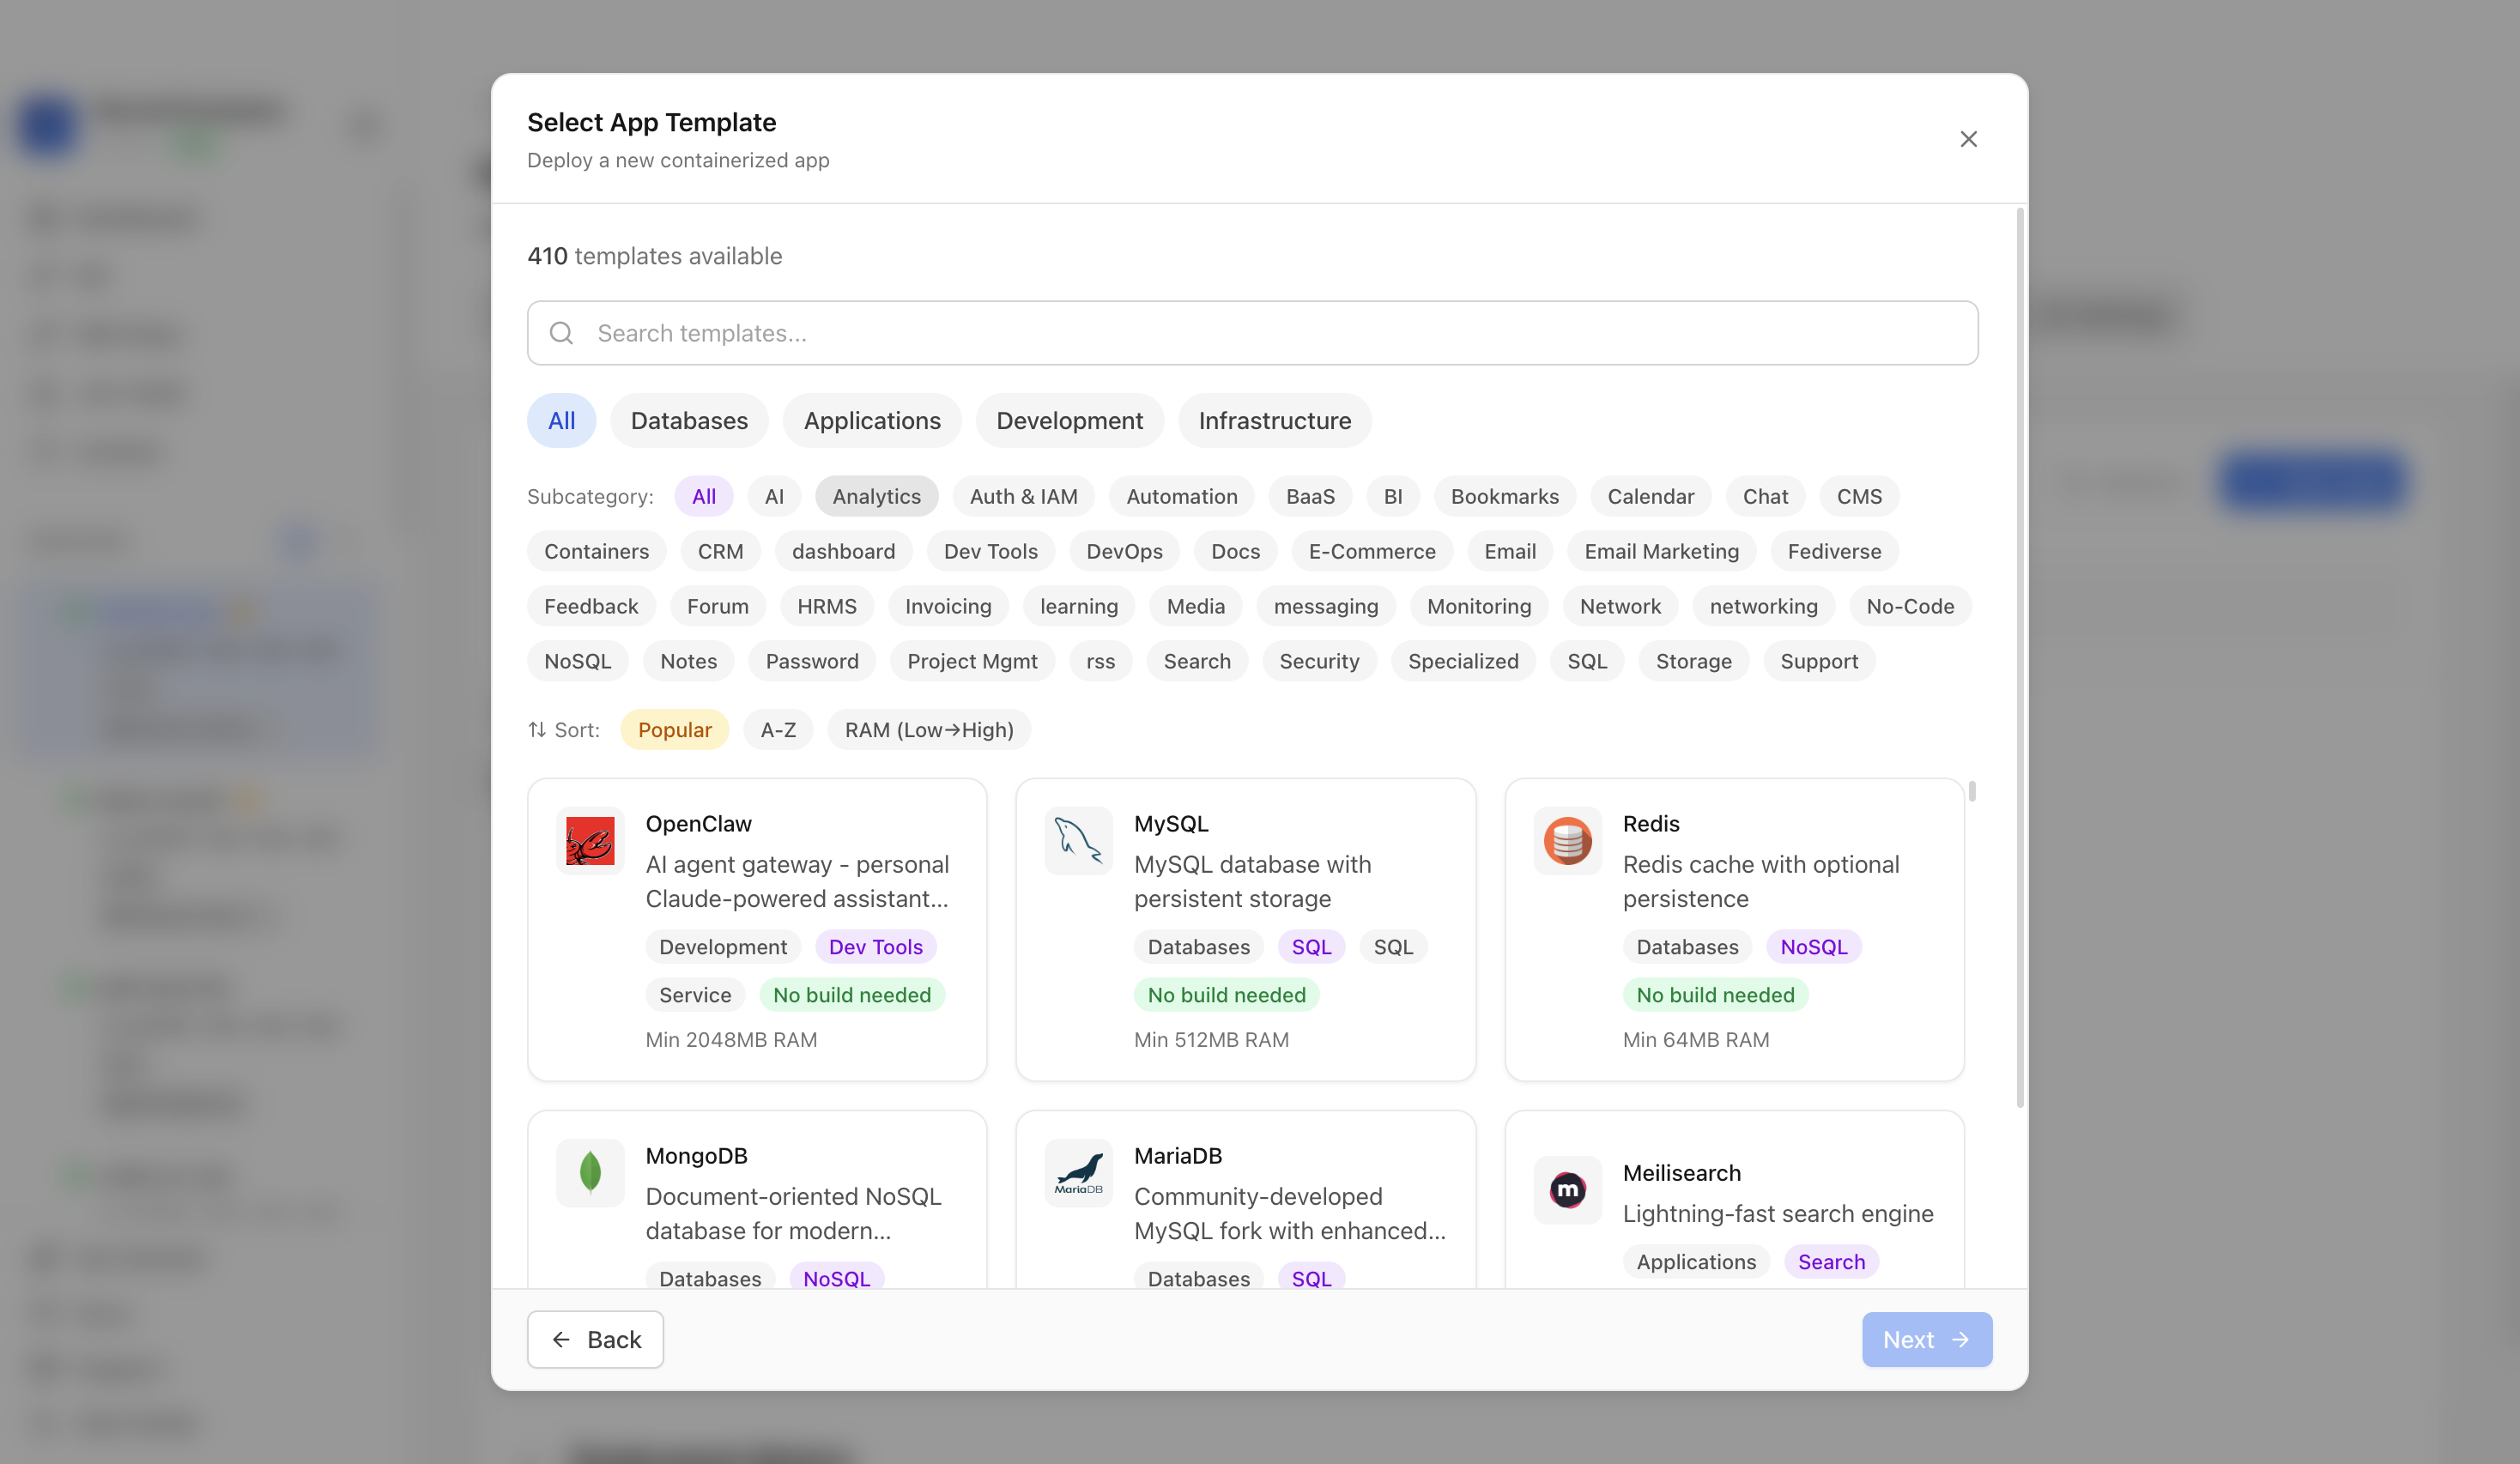
Choose from our template library
Fill in settings and click Deploy
Use the Komari Monitor template in Server Compass to deploy a lightweight self-hosted server monitoring dashboard on your VPS, then verify the web UI.
Select the tutorial-vps VPS, open the Apps tab, and start a new app deployment. Keep sensitive server details hidden before capturing or sharing screenshots.
Click New App and choose the template deployment path so Server Compass can load the built-in catalog.
Use the template picker search to find Komari Monitor in the Server Compass template catalog.
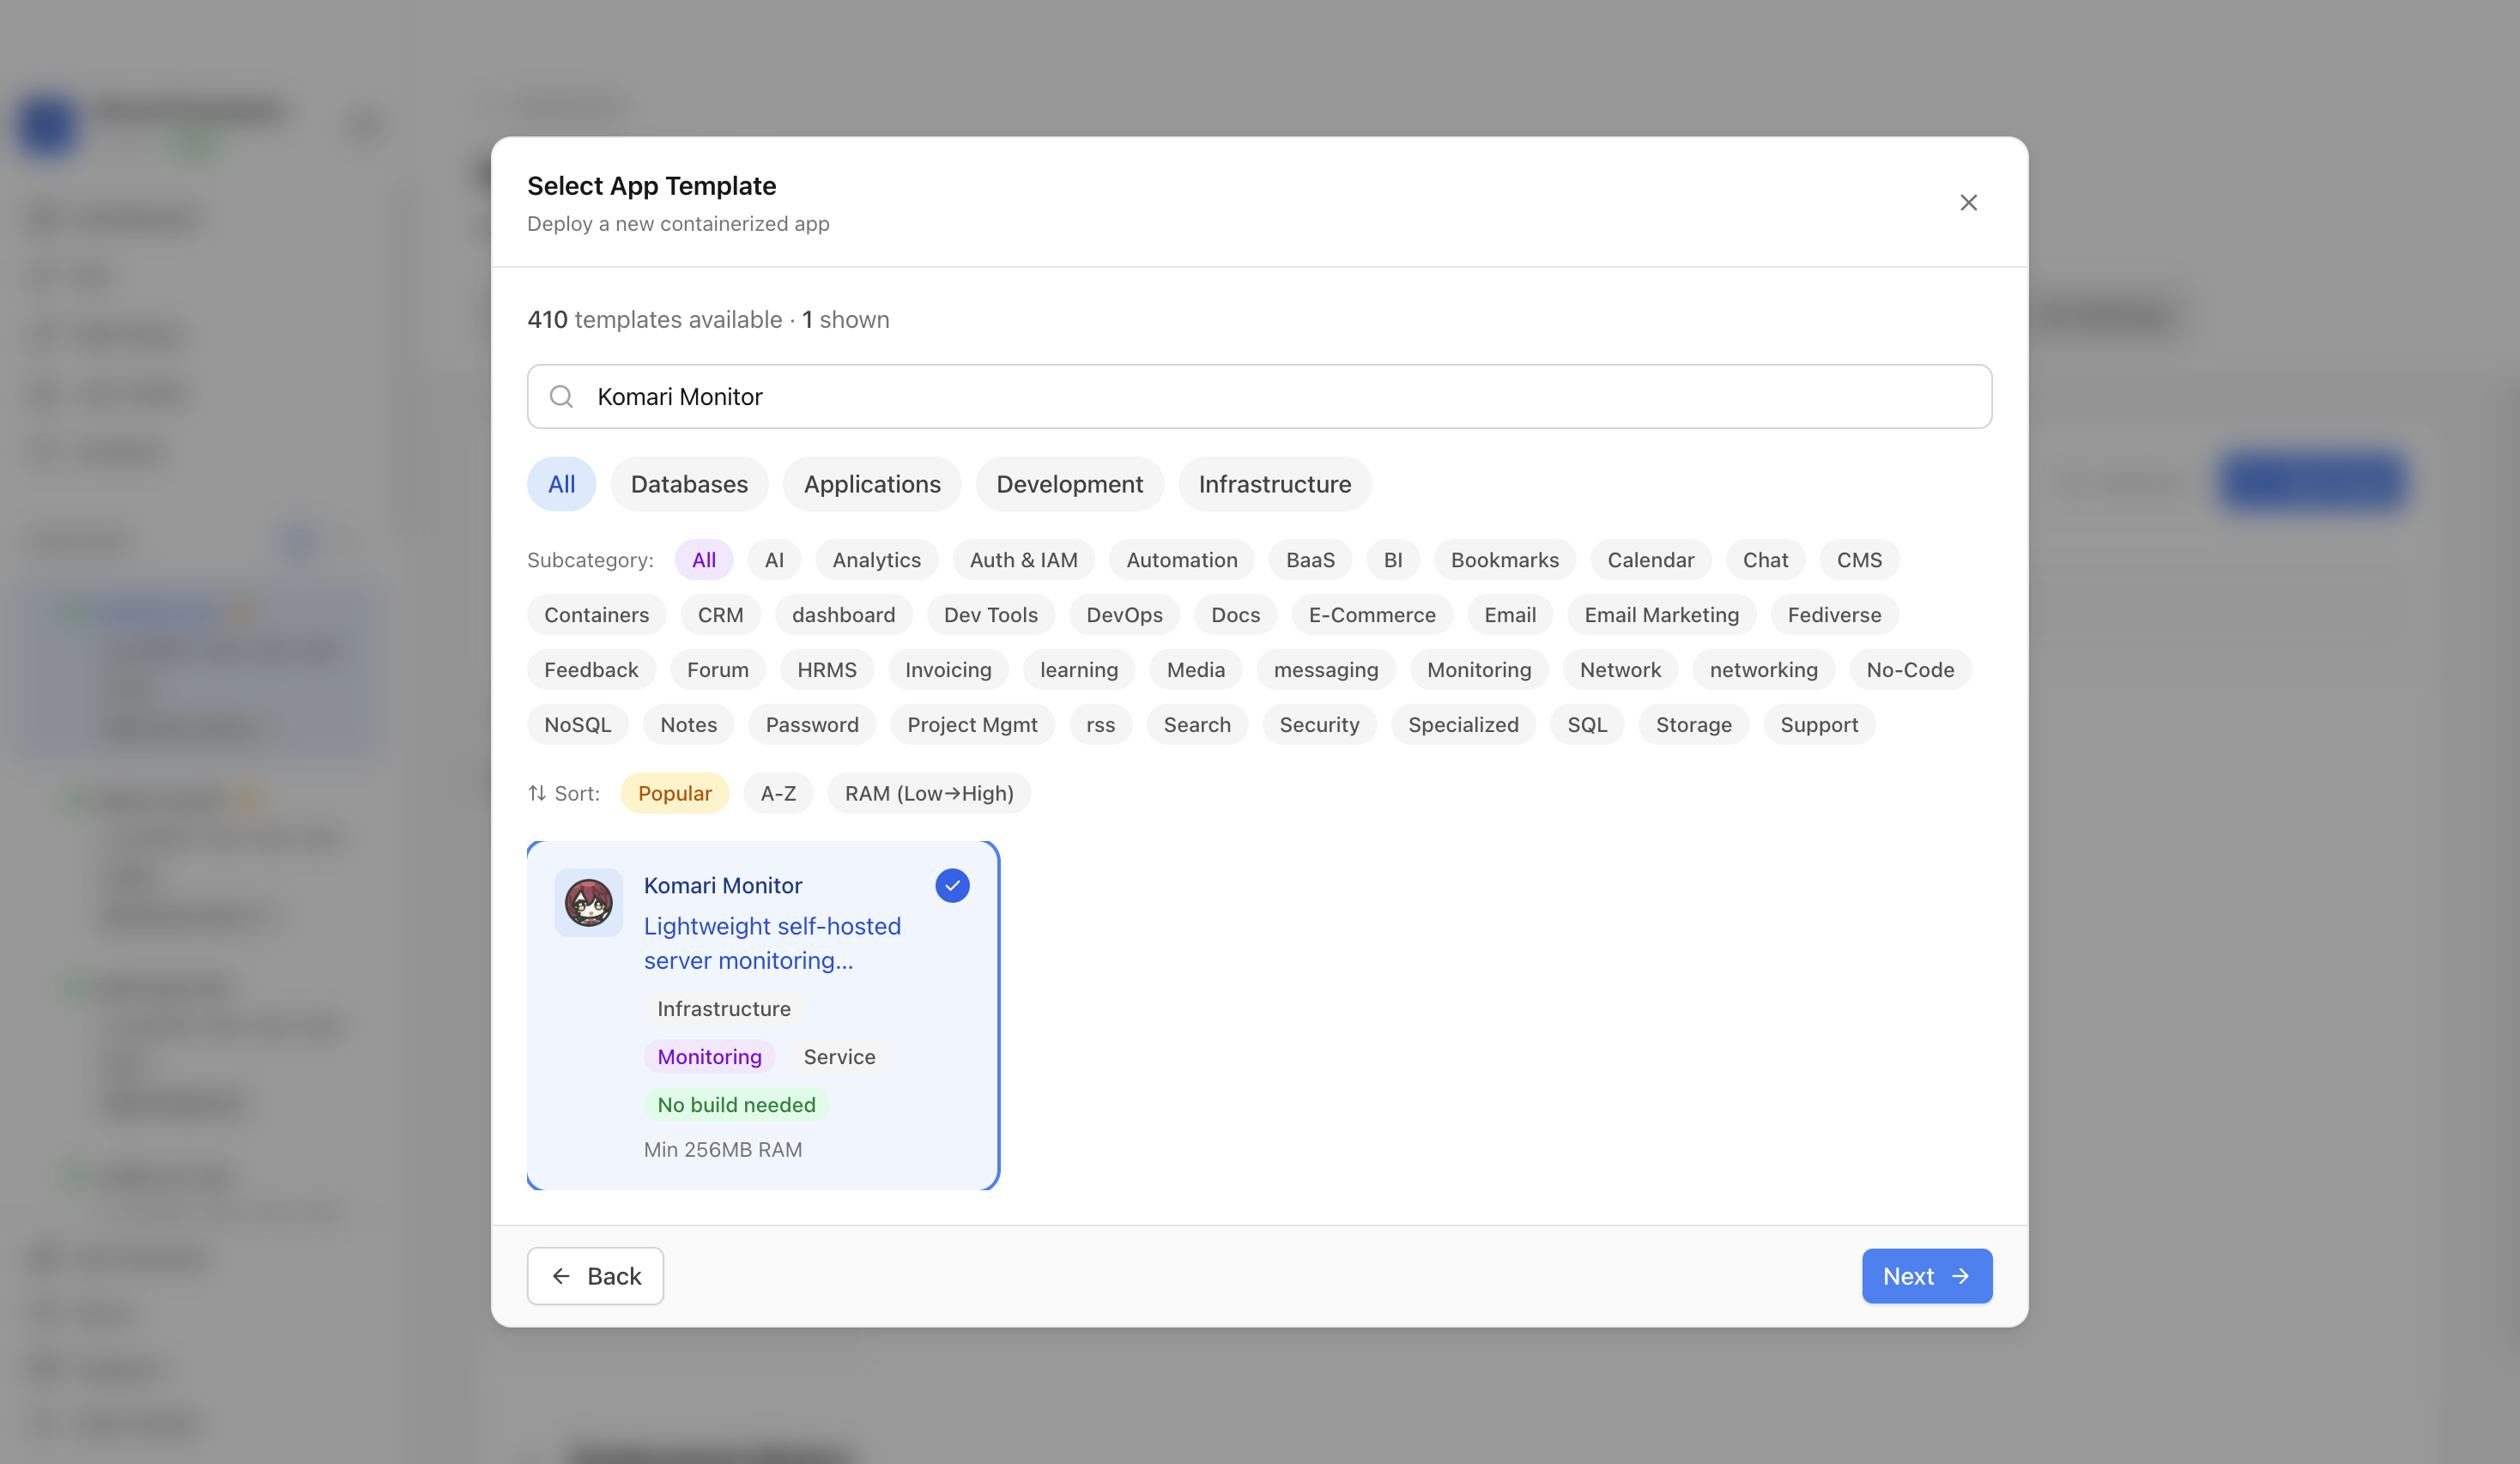
Choose the Komari Monitor template. Server Compass fills the Komari service, persistent data volume, and public web port.
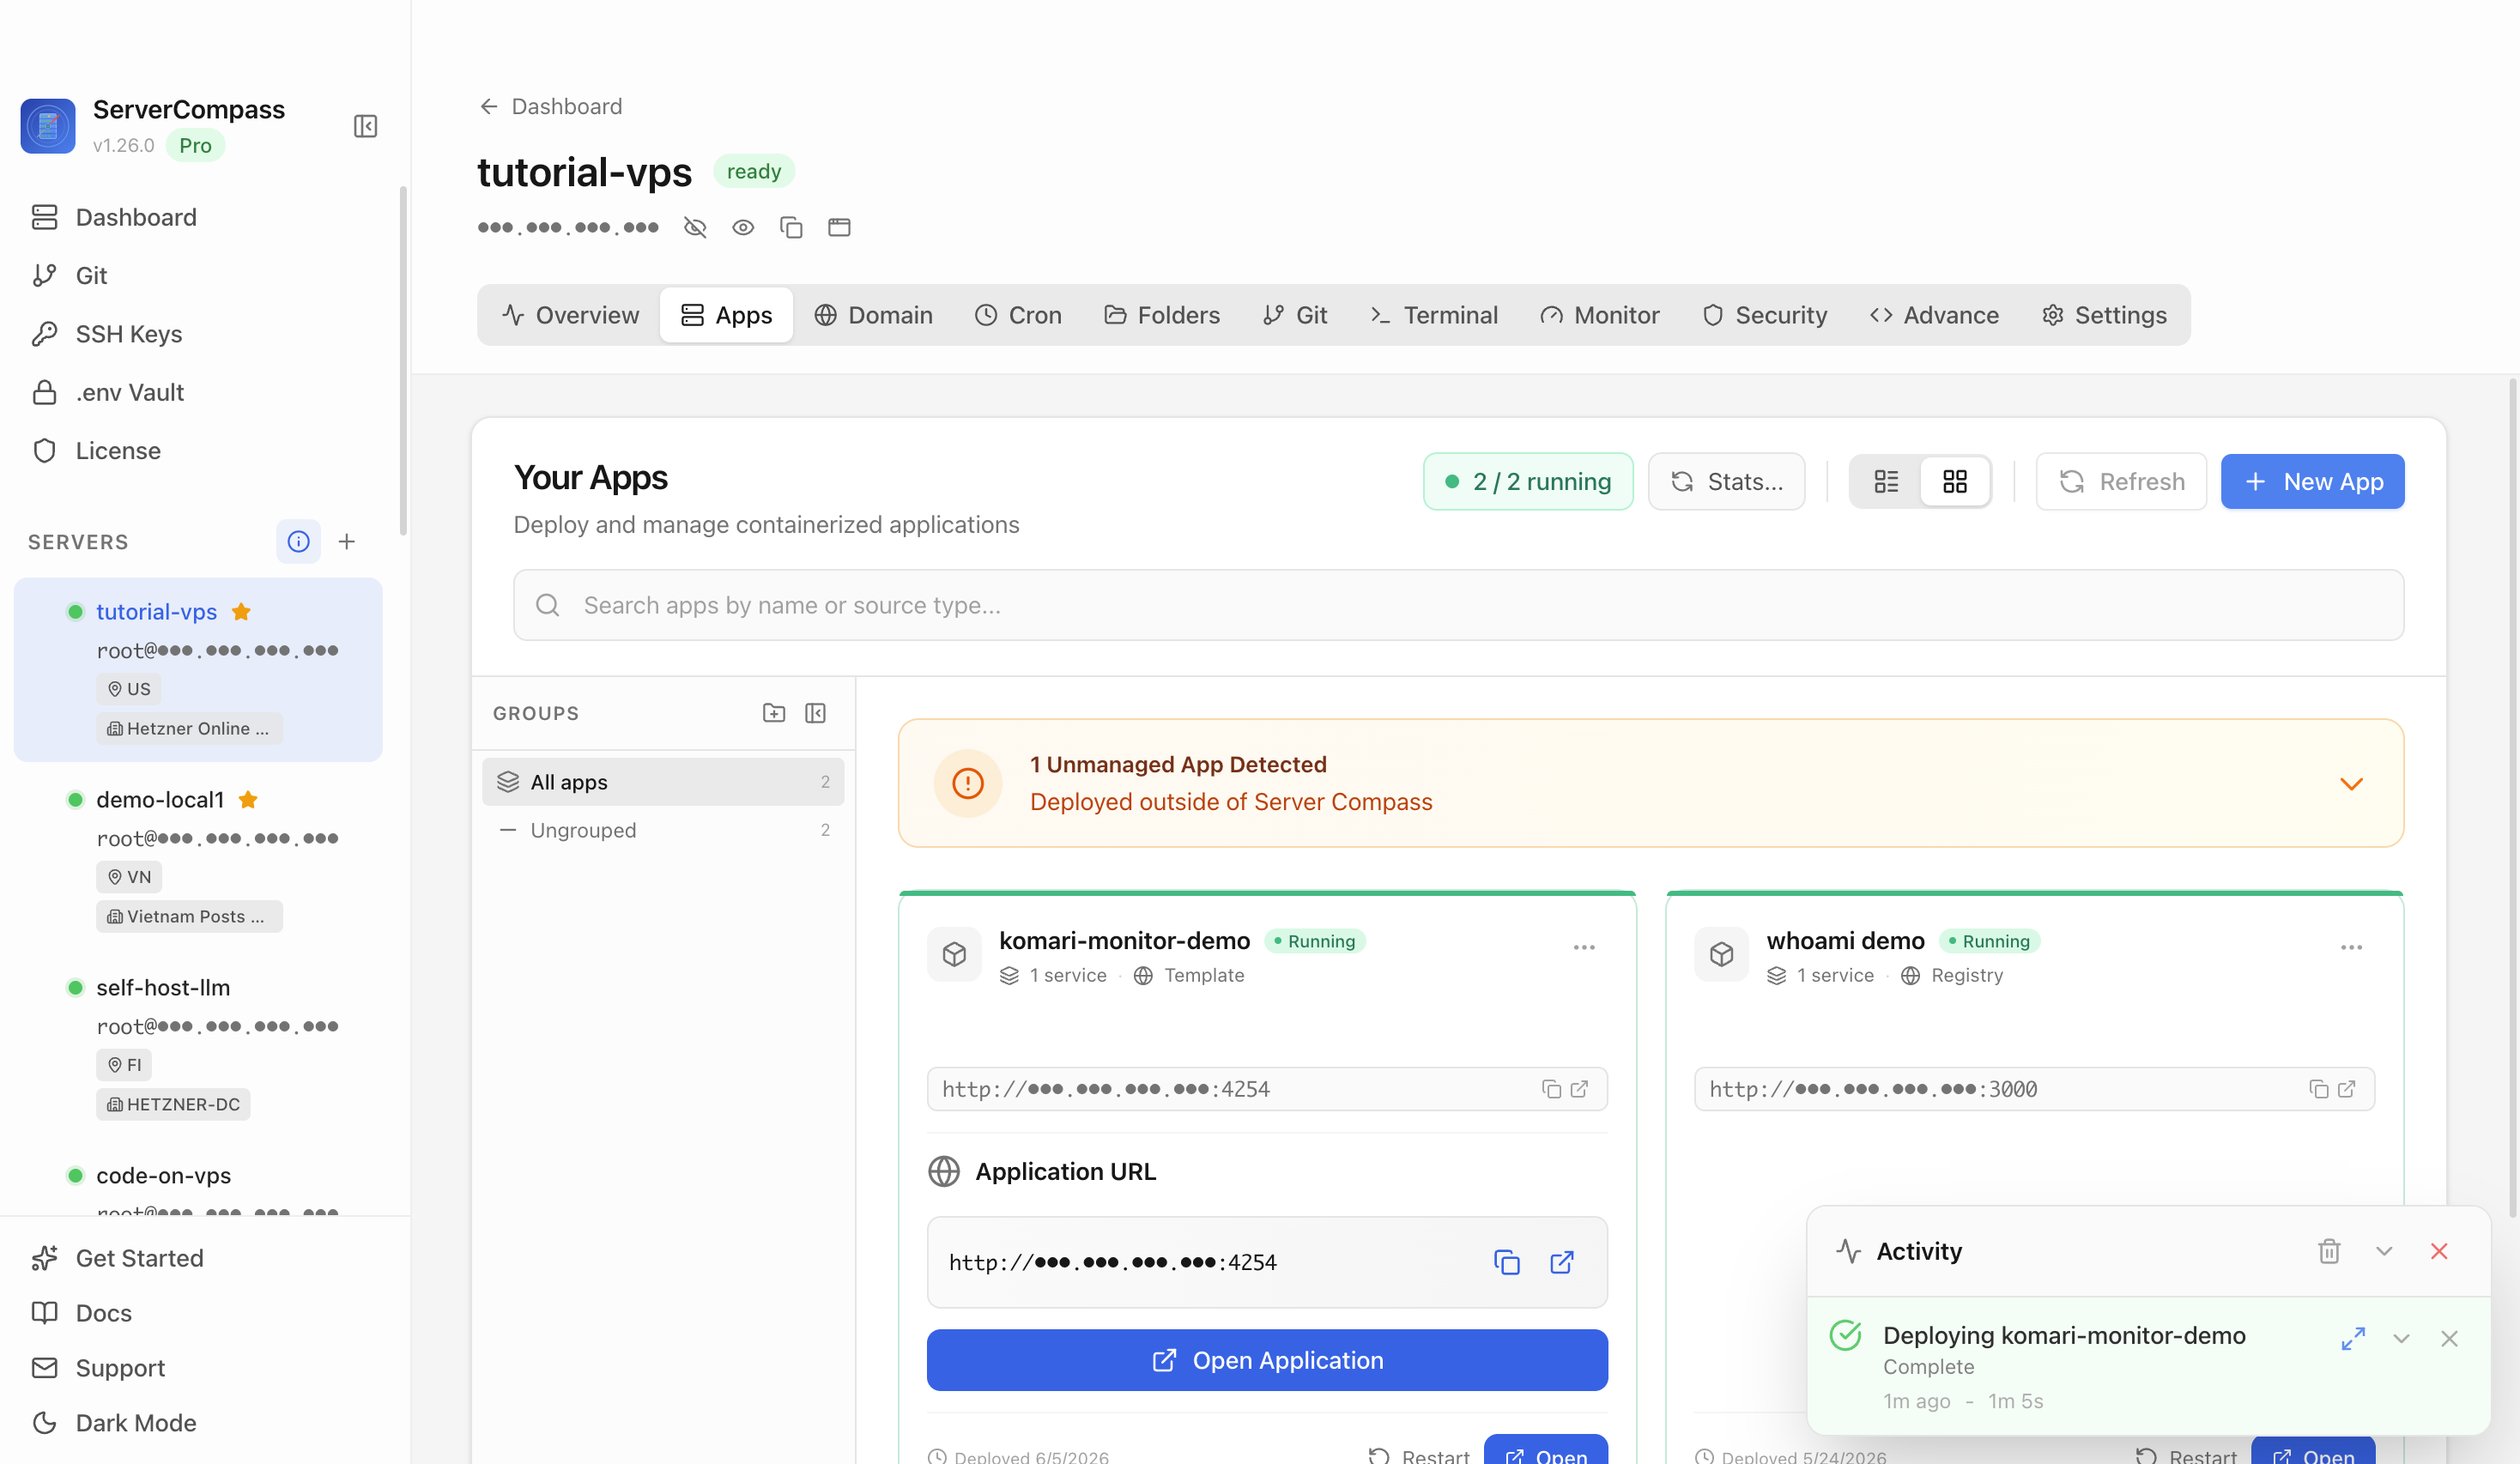
Confirm the app name and compose service. In this run, the app was named komari-monitor-demo and used host port 4254.
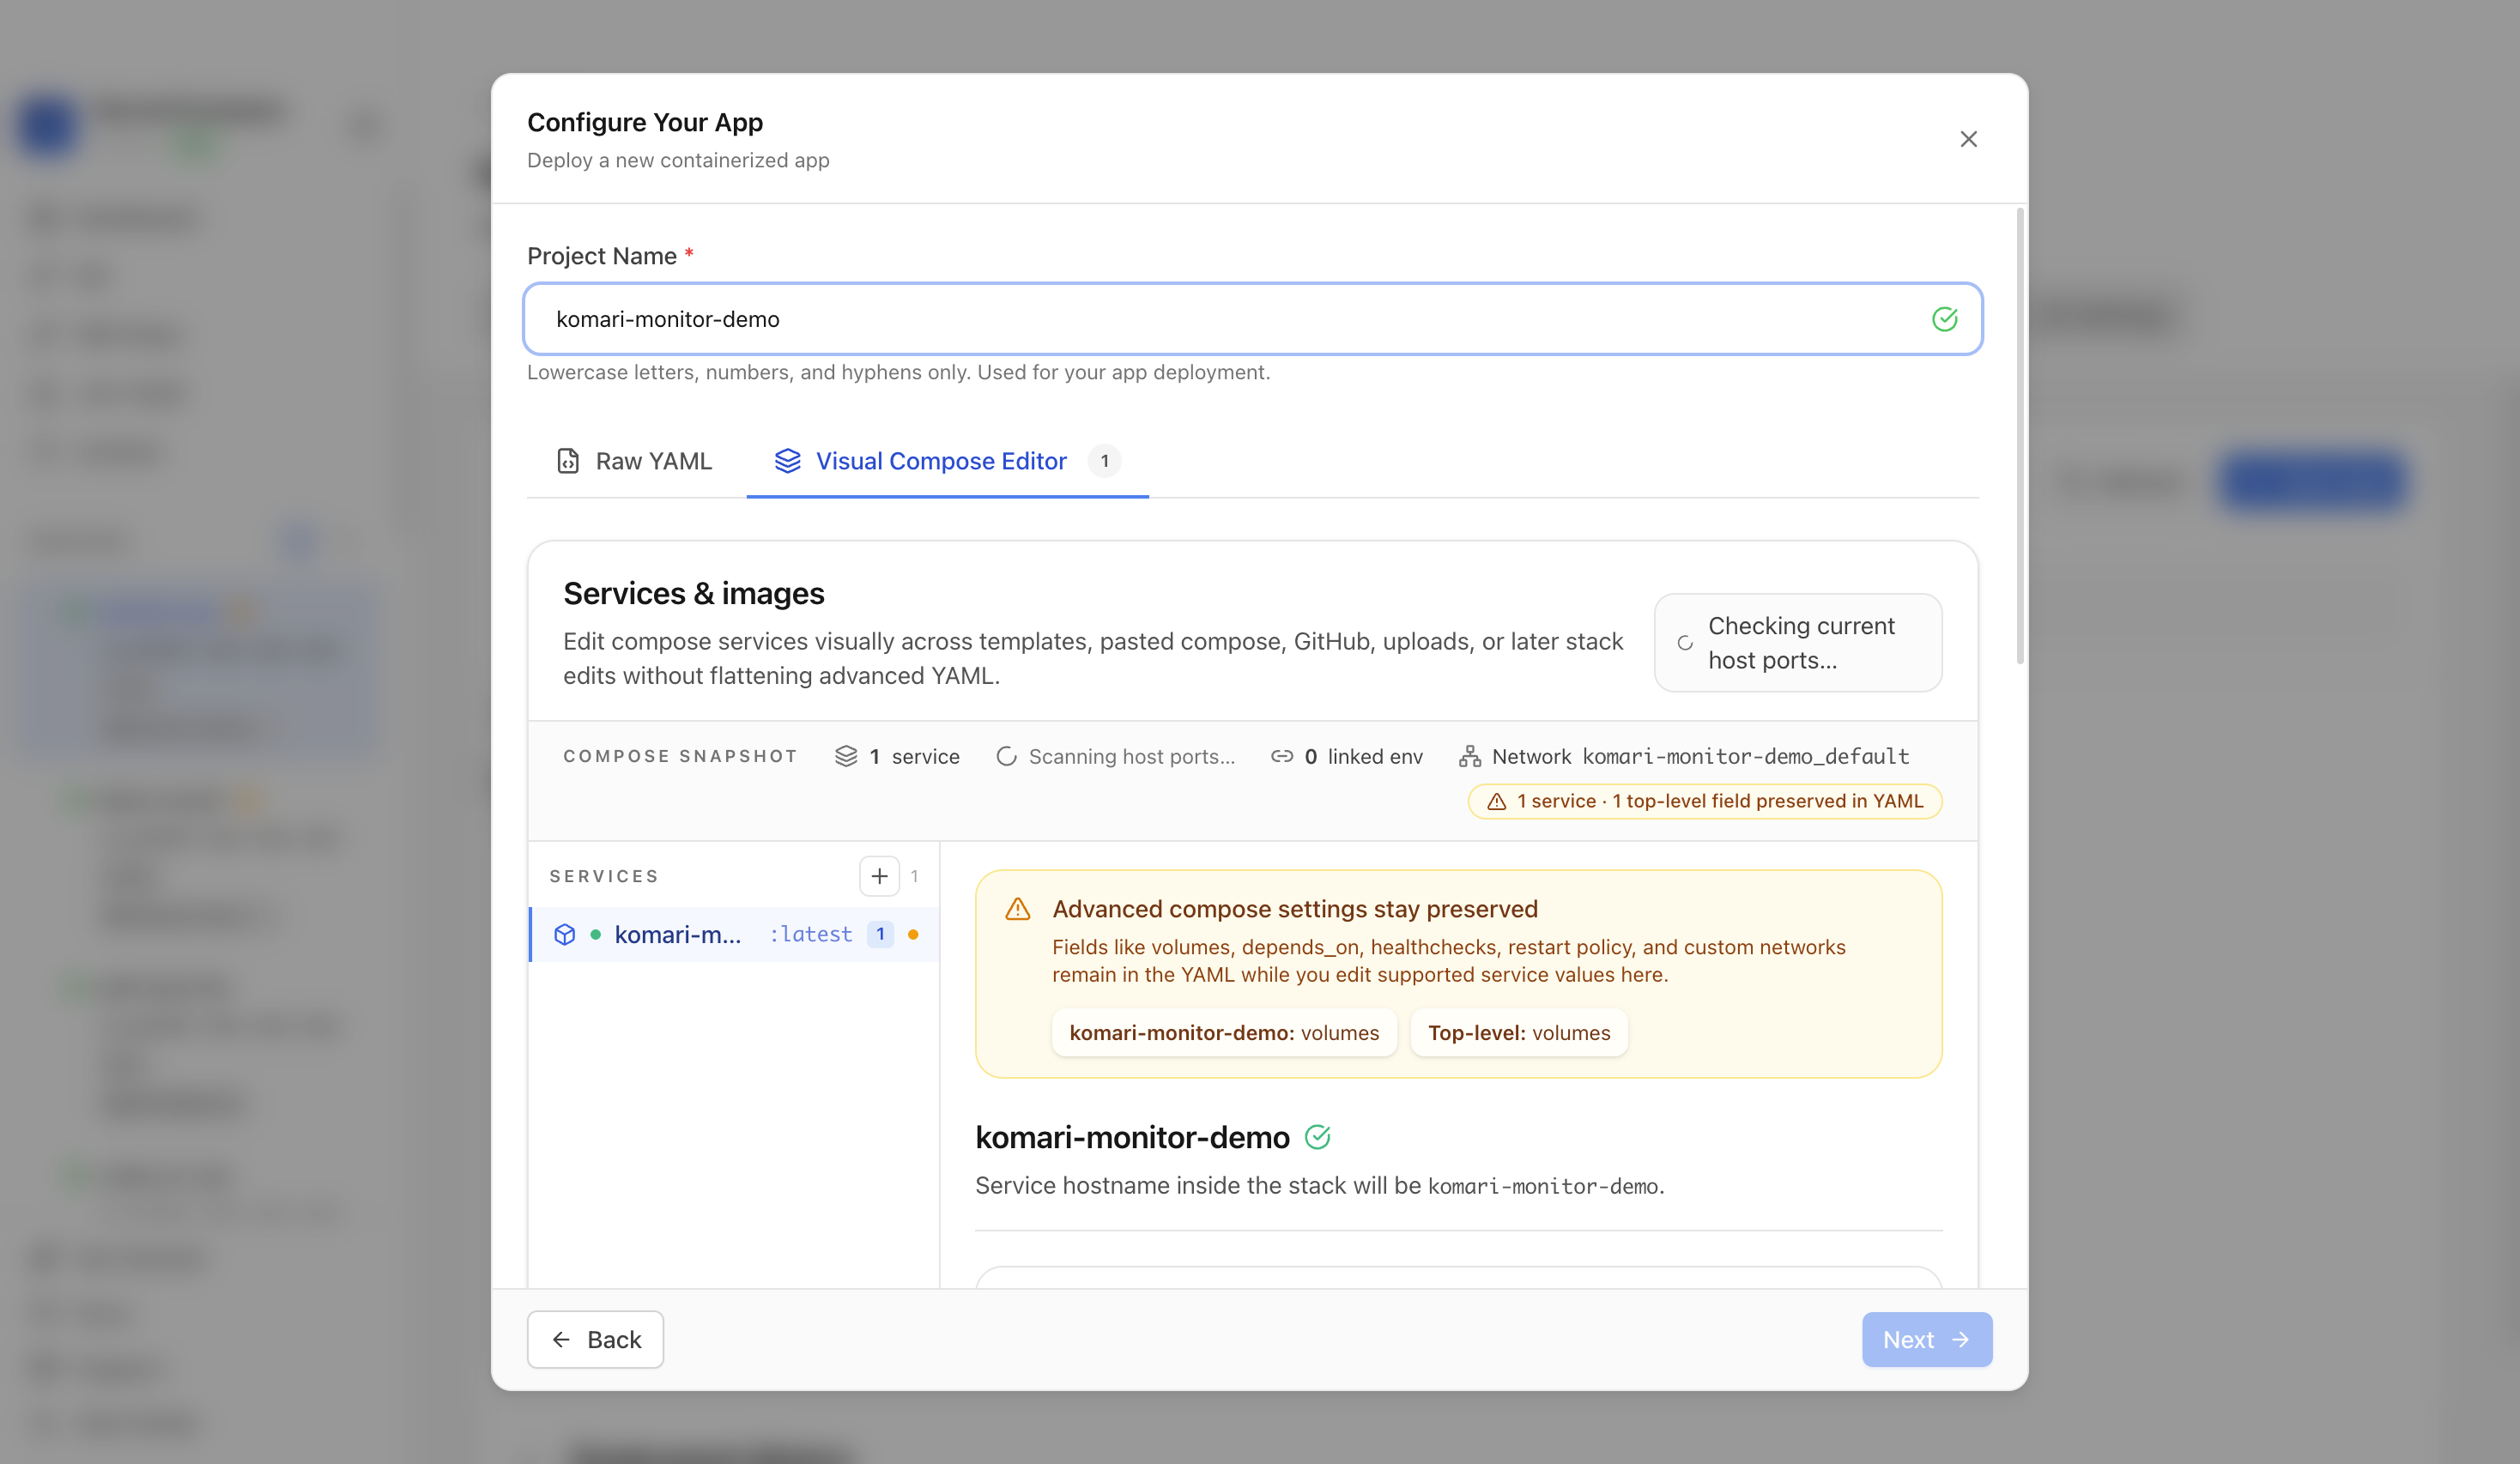
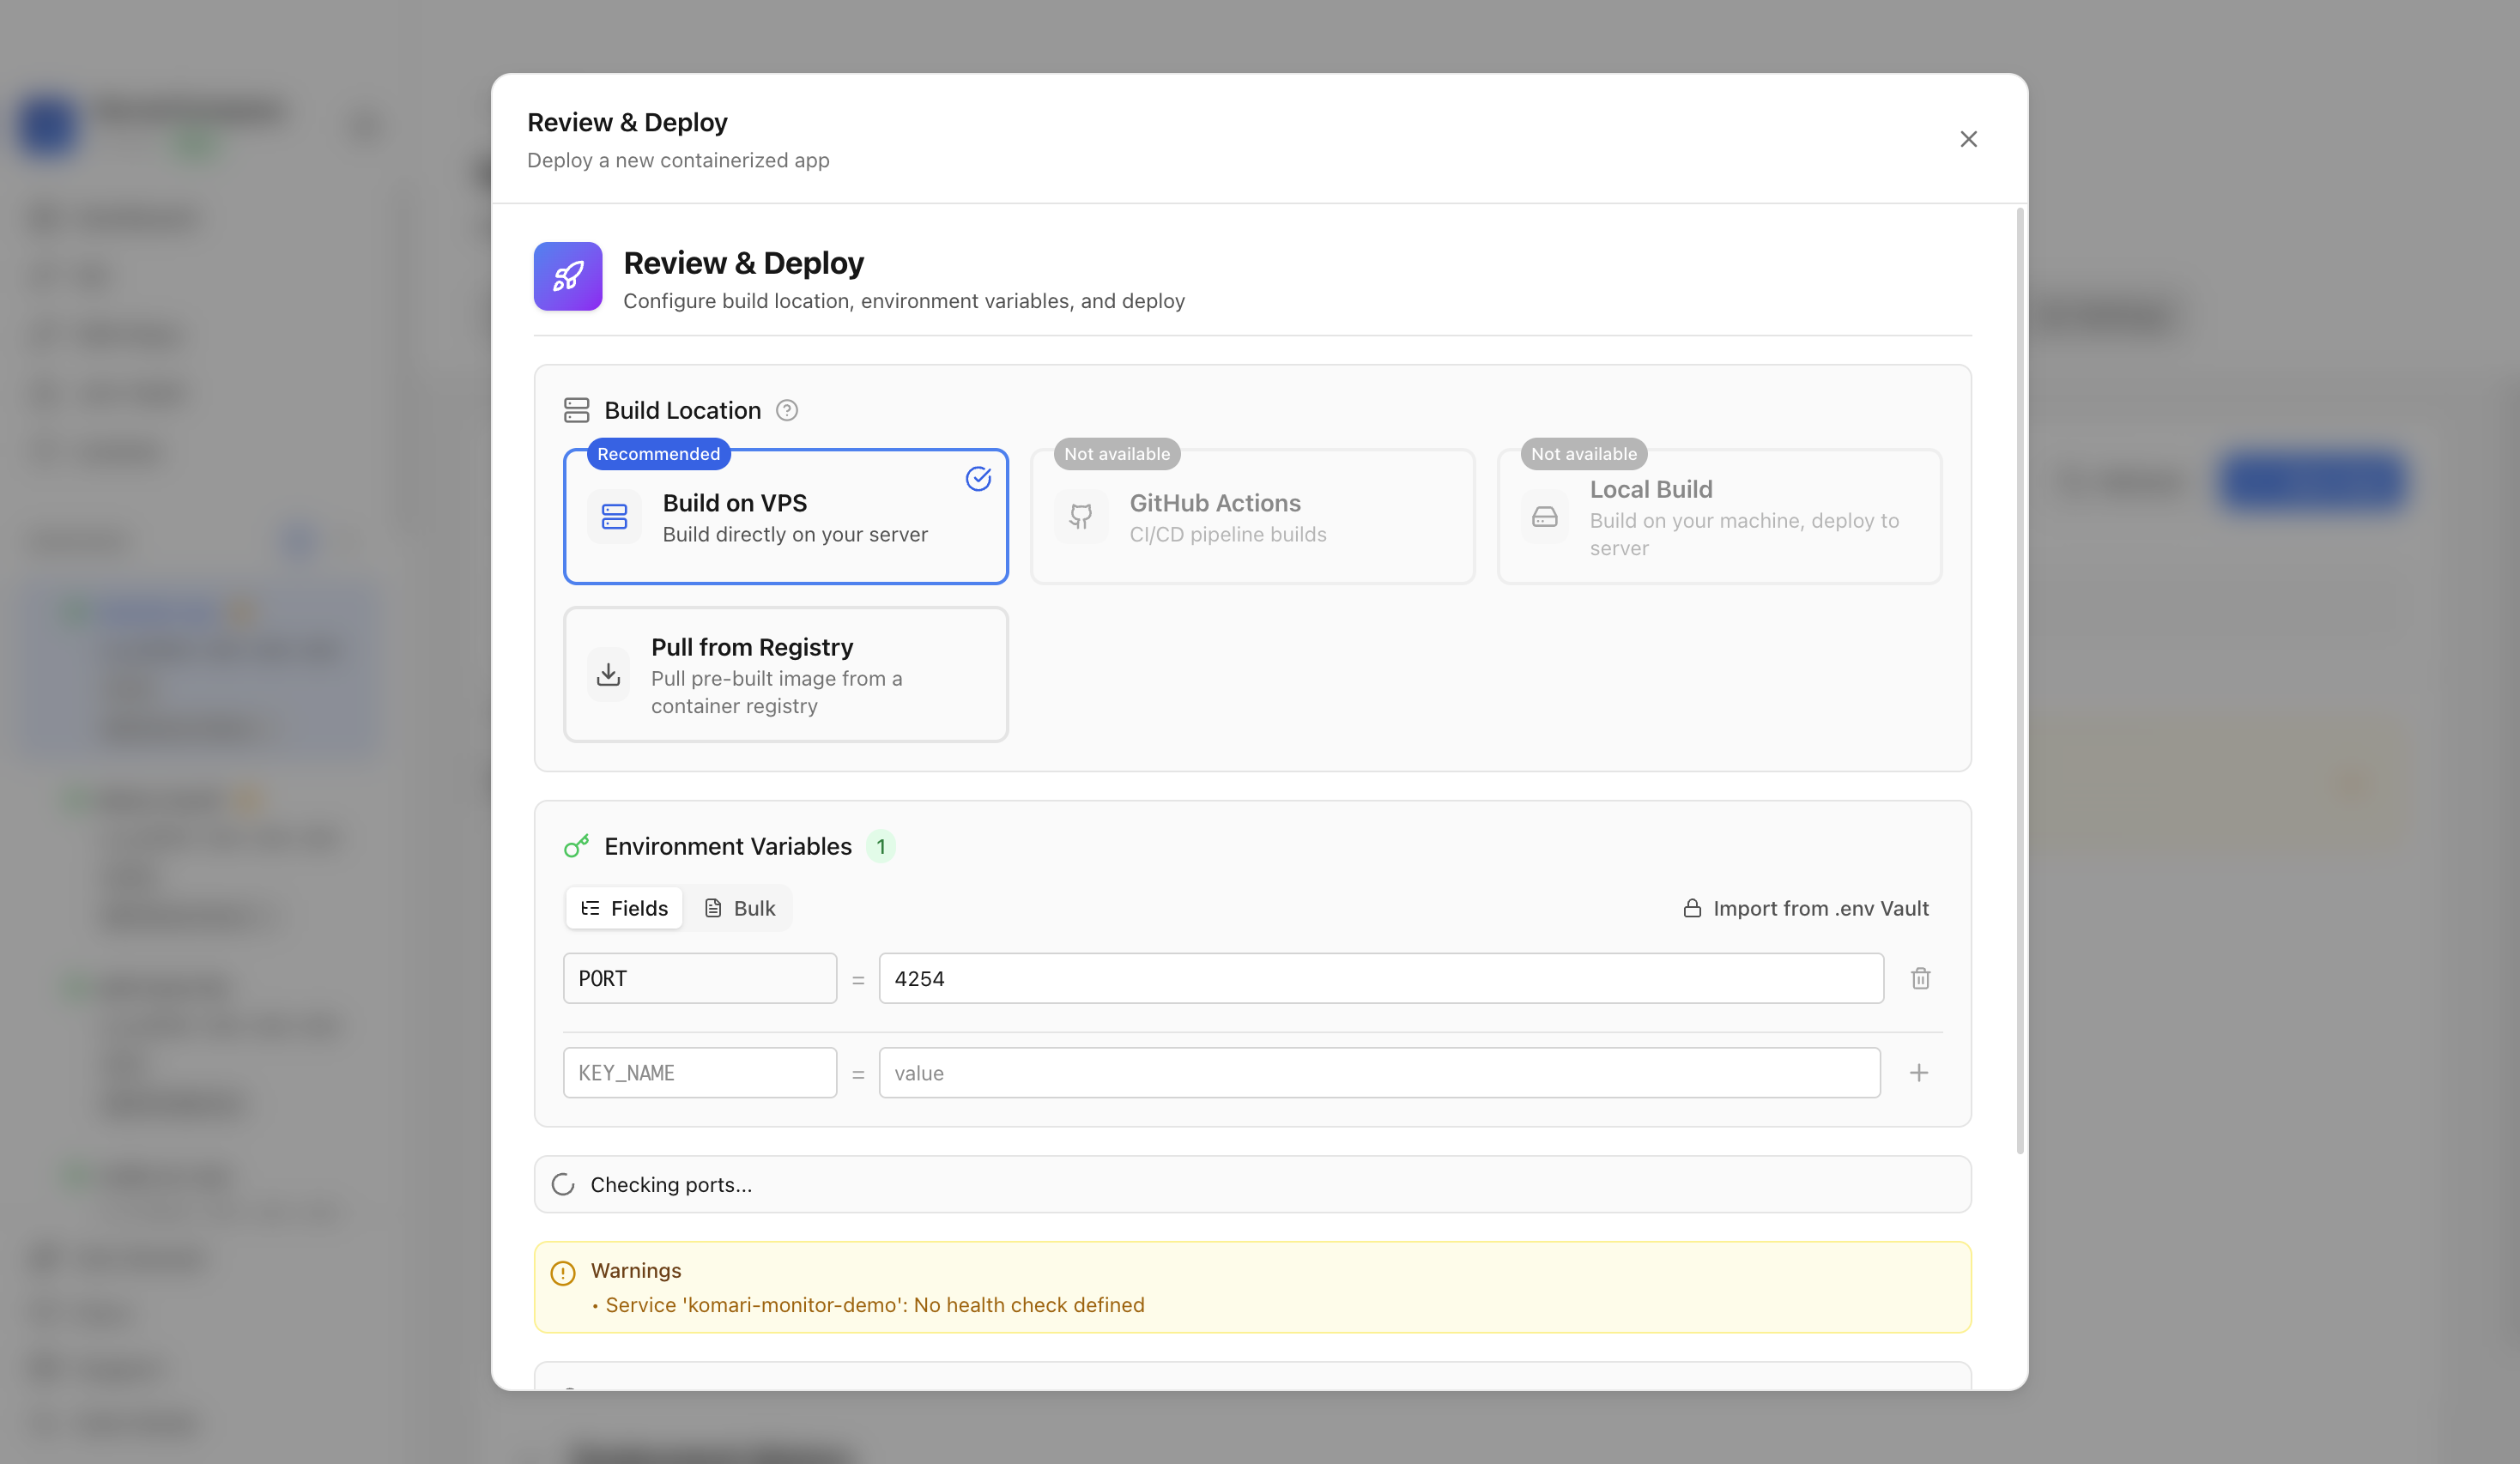
Review the generated compose settings, confirm the Komari Monitor web port is available, and click Deploy.
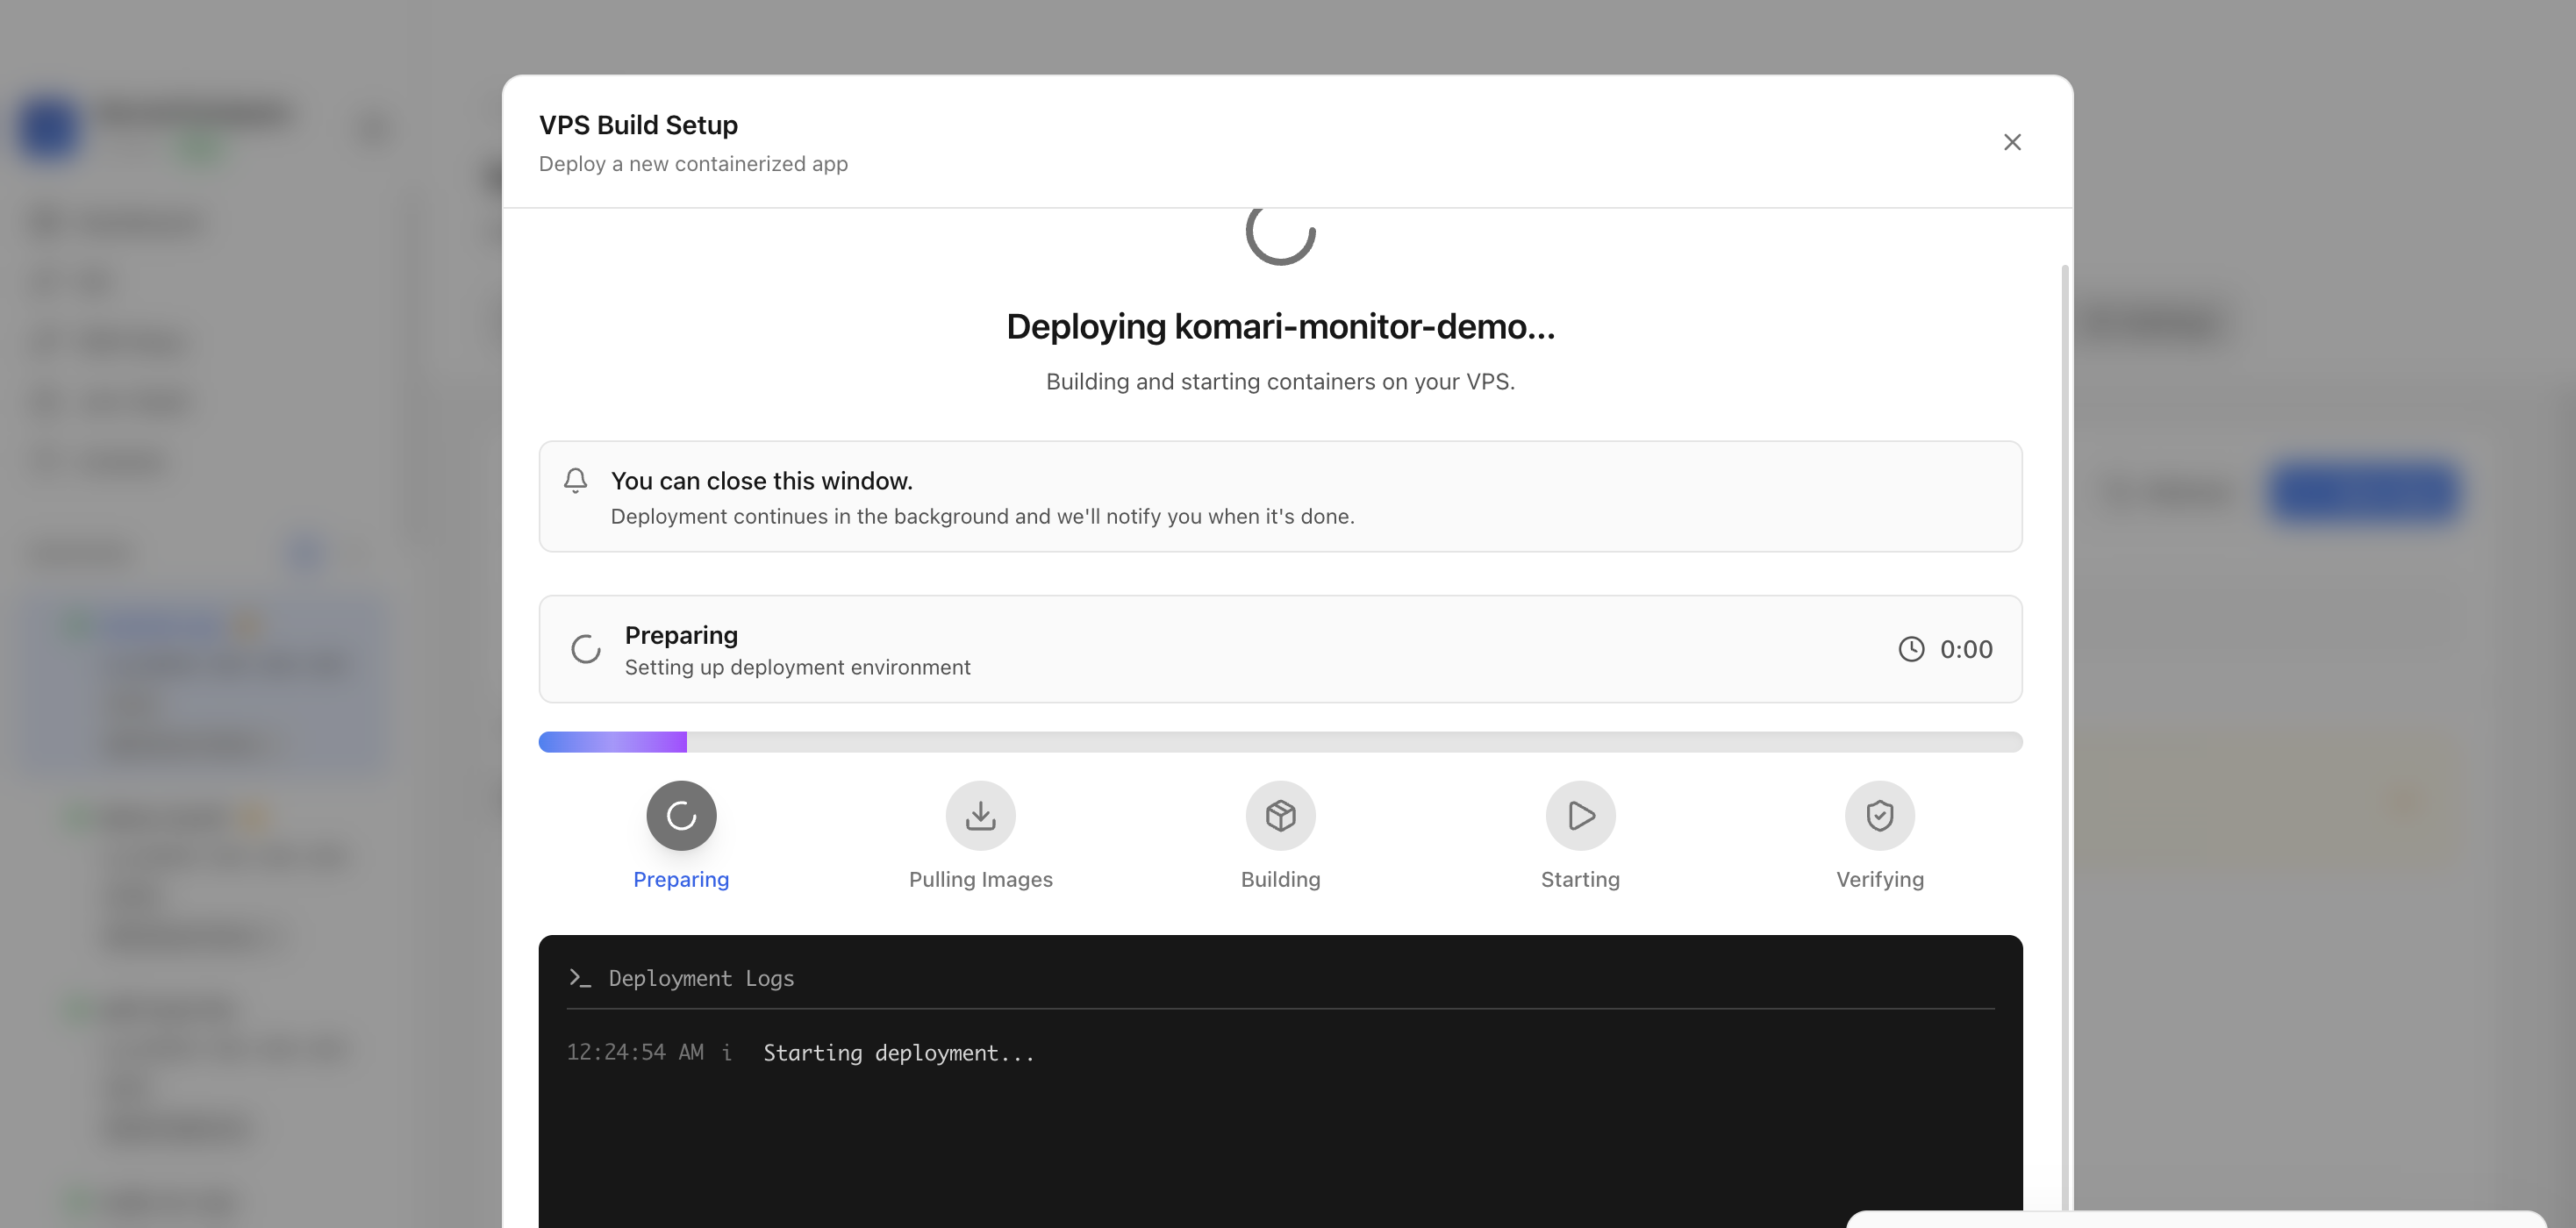
Keep the deployment modal open while Server Compass uploads the compose file, pulls the Komari Monitor image, starts the container, and verifies the stack.
After deployment finishes, return to the Apps tab and confirm the Komari Monitor app is marked Running with its application URL available.
Open the application URL in a browser. The Komari Monitor login or dashboard page confirms the monitoring service is reachable.
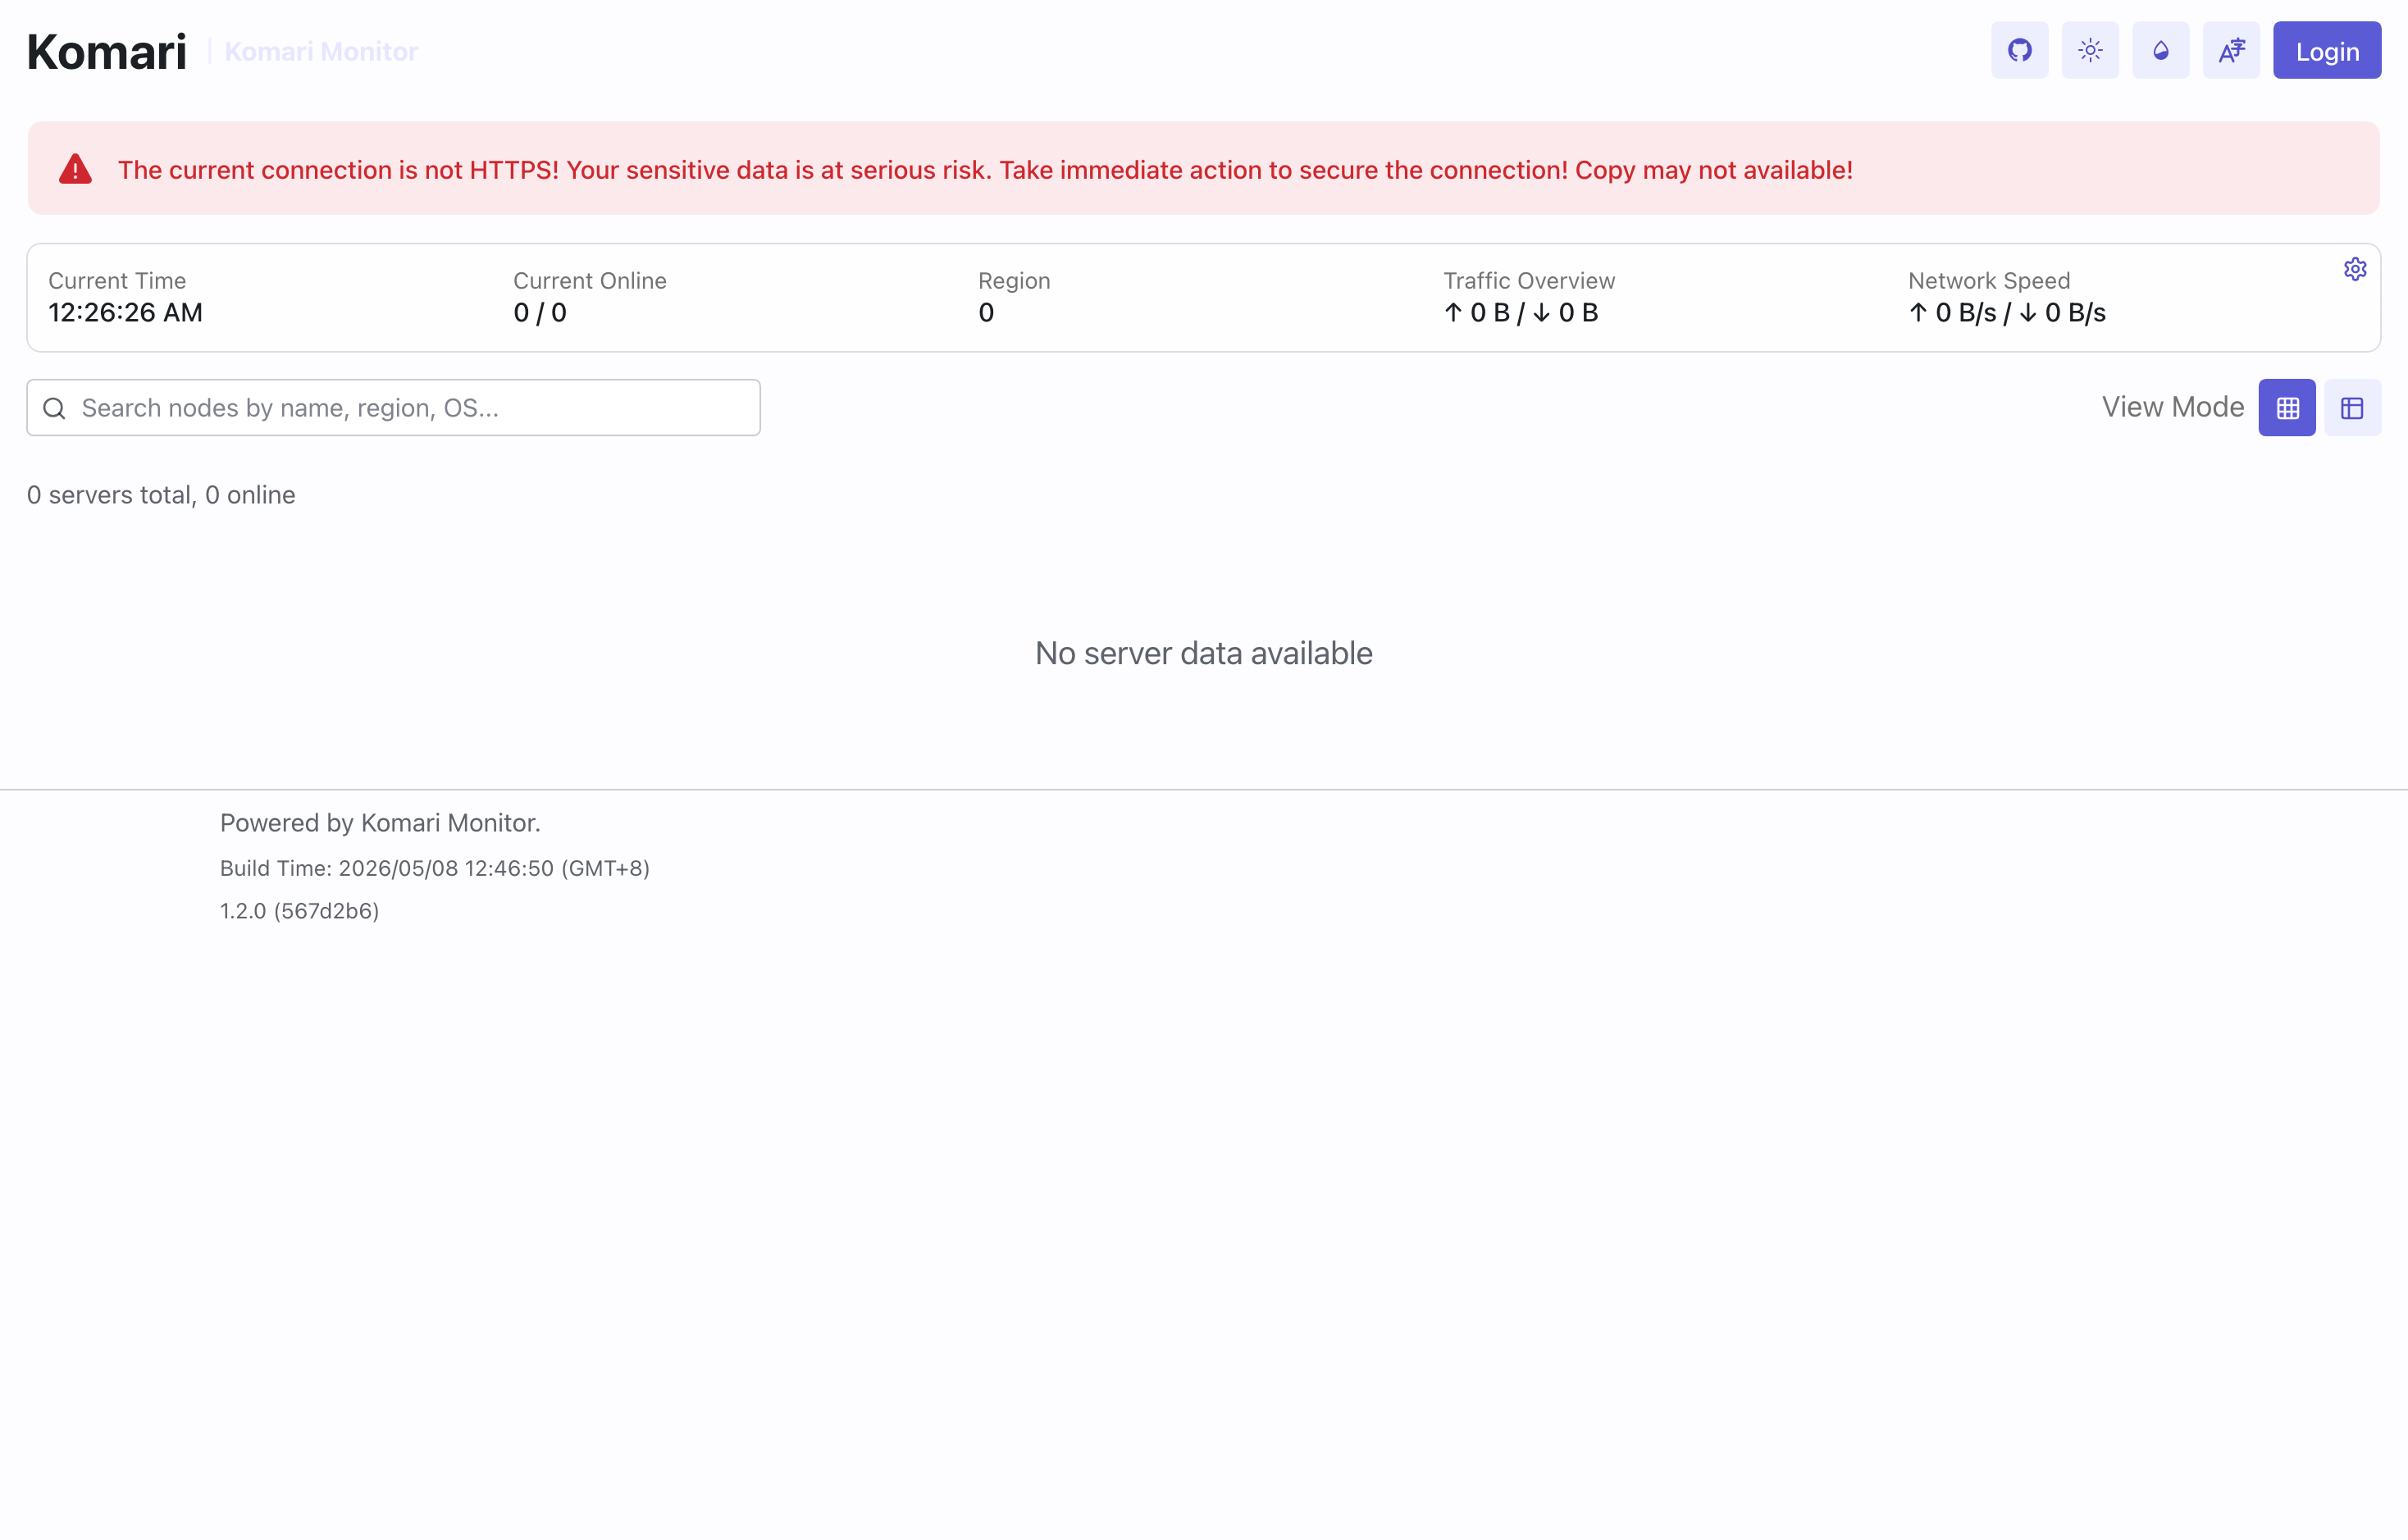
The Komari Monitor web interface loaded successfully from the deployed container.
It deploys Komari Monitor as a single-container monitoring dashboard with persistent local data storage.
The tutorial used host port 4254, which maps to the Komari Monitor web UI on container port 25774.
Yes. Open the app URL, sign in with the bootstrap credential from the logs, change the password, then add agents for monitored servers.
No. The deployment guide should live on the Komari Monitor template detail page and be linked from the reusable template deployment docs page.
After deploying Komari Monitor with Server Compass, complete these steps to finish setup
Open http://YOUR_SERVER_IP:{{PORT}}
Find the bootstrap admin password in the logs: `docker logs <komari-container> | grep -i password`
Sign in, change the admin password, and create additional users if needed
Generate an agent token under Settings -> Agents
Install the Komari agent on each target server using the documented installer and point it at `http://YOUR_SERVER_IP:{{PORT}}` with the token
Need help? Check out our documentation for detailed guides.
Common questions about self-hosting Komari Monitor
Simply download Server Compass, connect to your VPS, and select Komari Monitor from the templates list. Fill in the required configuration and click Deploy. The entire process takes under 3 minutes.
Komari Monitor requires a minimum of 256MB RAM. We recommend a VPS with at least 1024MB RAM for optimal performance. Any modern Linux server with Docker support will work.
Yes! Server Compass provides volume mapping that allows you to import existing data. You can also use standard Komari Monitor backup and restore procedures.
Server Compass makes updates easy. Simply click the Update button in your deployment dashboard, and the latest Komari Monitor image will be pulled and deployed with zero downtime.
Komari Monitor is open-source software. You only pay for your VPS hosting (typically $5-20/month) and optionally Server Compass ($29 one-time). No subscription fees or per-seat pricing.
Download Server Compass and deploy Komari Monitor to your VPS in under 3 minutes. No Docker expertise required.
Download Server Compass