April 15, 2026
Why Self-Hosted VPS Setups Break at 2 AM and How to Catch Issues First
A practical 15-minute self-hosted monitoring baseline for VPS apps: uptime checks, Docker alerts, CPU/RAM/disk thresholds, SSL expiry checks, notifications, and incident drills.

The most painful self-hosting outage is not the one where a container crashes. It is the one where a container crashes, the SSL certificate expires, or the disk fills up, and the first signal comes from a user asking why the app is down.
That pattern shows up constantly in self-hosting and homelab discussions: people move from managed platforms to a VPS, gain control and lower costs, then realize they also lost the built-in alerts that used to tell them when something was unhealthy.
The fix is not a giant observability stack on day one. Start with a small baseline that catches the failures users actually notice.
Quick answer: what should you monitor first?
For most self-hosted VPS apps, the first monitoring layer should cover public uptime, Docker container health, CPU, memory, disk usage, SSL certificate expiry, and deployment failure notifications. That gives you early warning for the outages users feel first: expired HTTPS, 502 errors, full disks, crashed containers, and database connection failures.
1. List the services that matter
Do not begin with every metric your server can produce. Begin with what must be true for your product to work:
- The public app URL returns a healthy response.
- The reverse proxy can route traffic to the app container.
- The database accepts connections.
- The disk has enough free space for logs, builds, and database writes.
- The SSL certificate is valid and not close to expiry.
In Server Compass, keep these services visible from the app dashboard and container status views. The point is to make the current state obvious before you open a terminal.
2. Add outside-in uptime checks
A container can be running while the app is still unreachable. That is why every production app needs at least one outside-in check against the public URL. Use a lightweight /health endpoint if your app has one, or a simple page that exercises the app and database path.
A useful first baseline:
- Check the production URL every 60 seconds.
- Alert after 2 or 3 consecutive failures, not after one noisy blip.
- Track response code and response time.
- Run the check from outside the VPS network.
Server Compass can also deploy templates like Uptime Kuma when you want a dedicated self-hosted uptime checker alongside the built-in status and alerting tools. That gives you both a VPS monitoring dashboard and an outside-in website uptime monitor.
3. Watch host and container resources
The classic 2 AM failure is usually boring: memory pressure, a runaway log file, a full disk, or a container that restarted until the app entered a bad state. Add host-level and container-level thresholds before chasing advanced metrics.

Use the Server Compass monitoring agent to track CPU, RAM, disk, and container usage continuously. Then create alert rules for the thresholds you would act on:
Signal
Starter threshold
Why it matters
Disk usage
80% warning, 90% critical
Databases and Docker builds fail badly when disk runs out.
Memory usage
85% for 10 minutes
Sustained pressure often comes before OOM kills.
Container restarts
Any unexpected restart
A running container is not always a stable container.
CPU usage
90% for 15 minutes
Useful for runaway jobs, crawlers, and inefficient deploys.
4. Treat SSL expiry as an outage
An expired certificate looks like a hard outage to most users. Add SSL checks to the same alert path as uptime and disk. The check should warn early enough that you can fix DNS, proxy, or ACME renewal issues during normal hours.
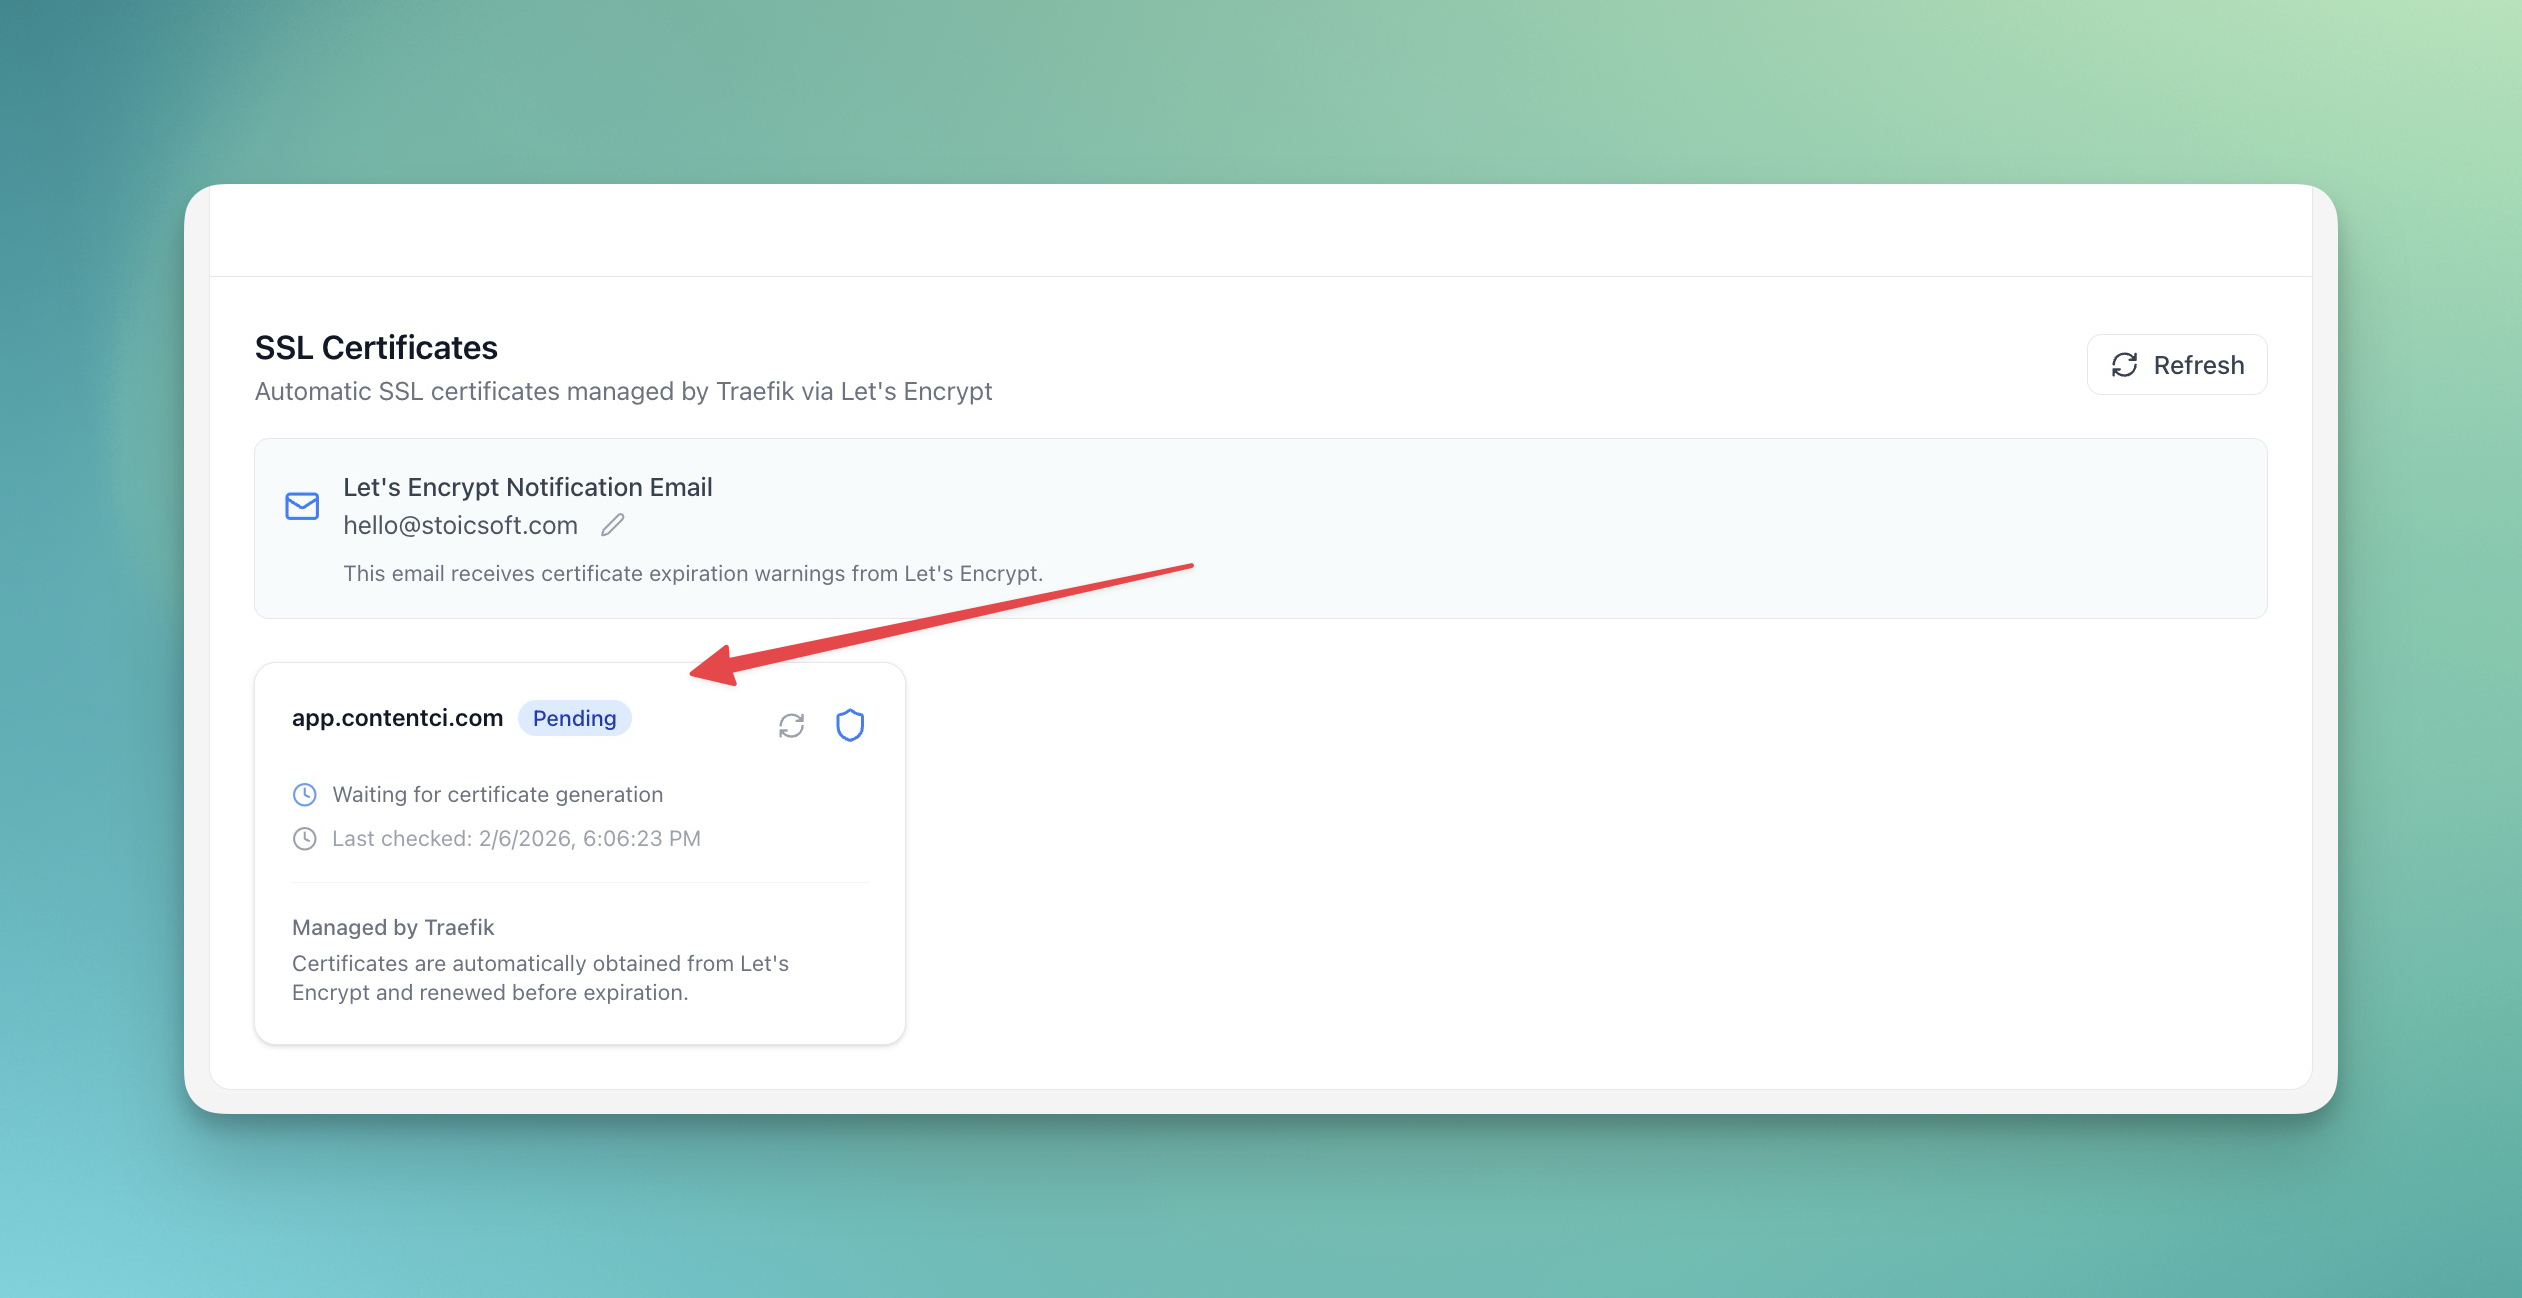
Server Compass shows certificate details from the domain panel, including issuer and expiry data. Pair the certificate viewer with DNS verification so you can confirm that the domain is pointed correctly before renewal problems turn into support tickets.
5. Route alerts somewhere you will actually see
Alerts are only useful if they land where you respond. For solo developers, that might be Telegram, Discord, email, or a webhook into a team chat. For teams, use severity levels:
- Critical: public app down, database unreachable, disk above 90%.
- Warning: disk above 80%, SSL expires soon, memory pressure.
- Info: successful deploys, scheduled backups, maintenance tasks.
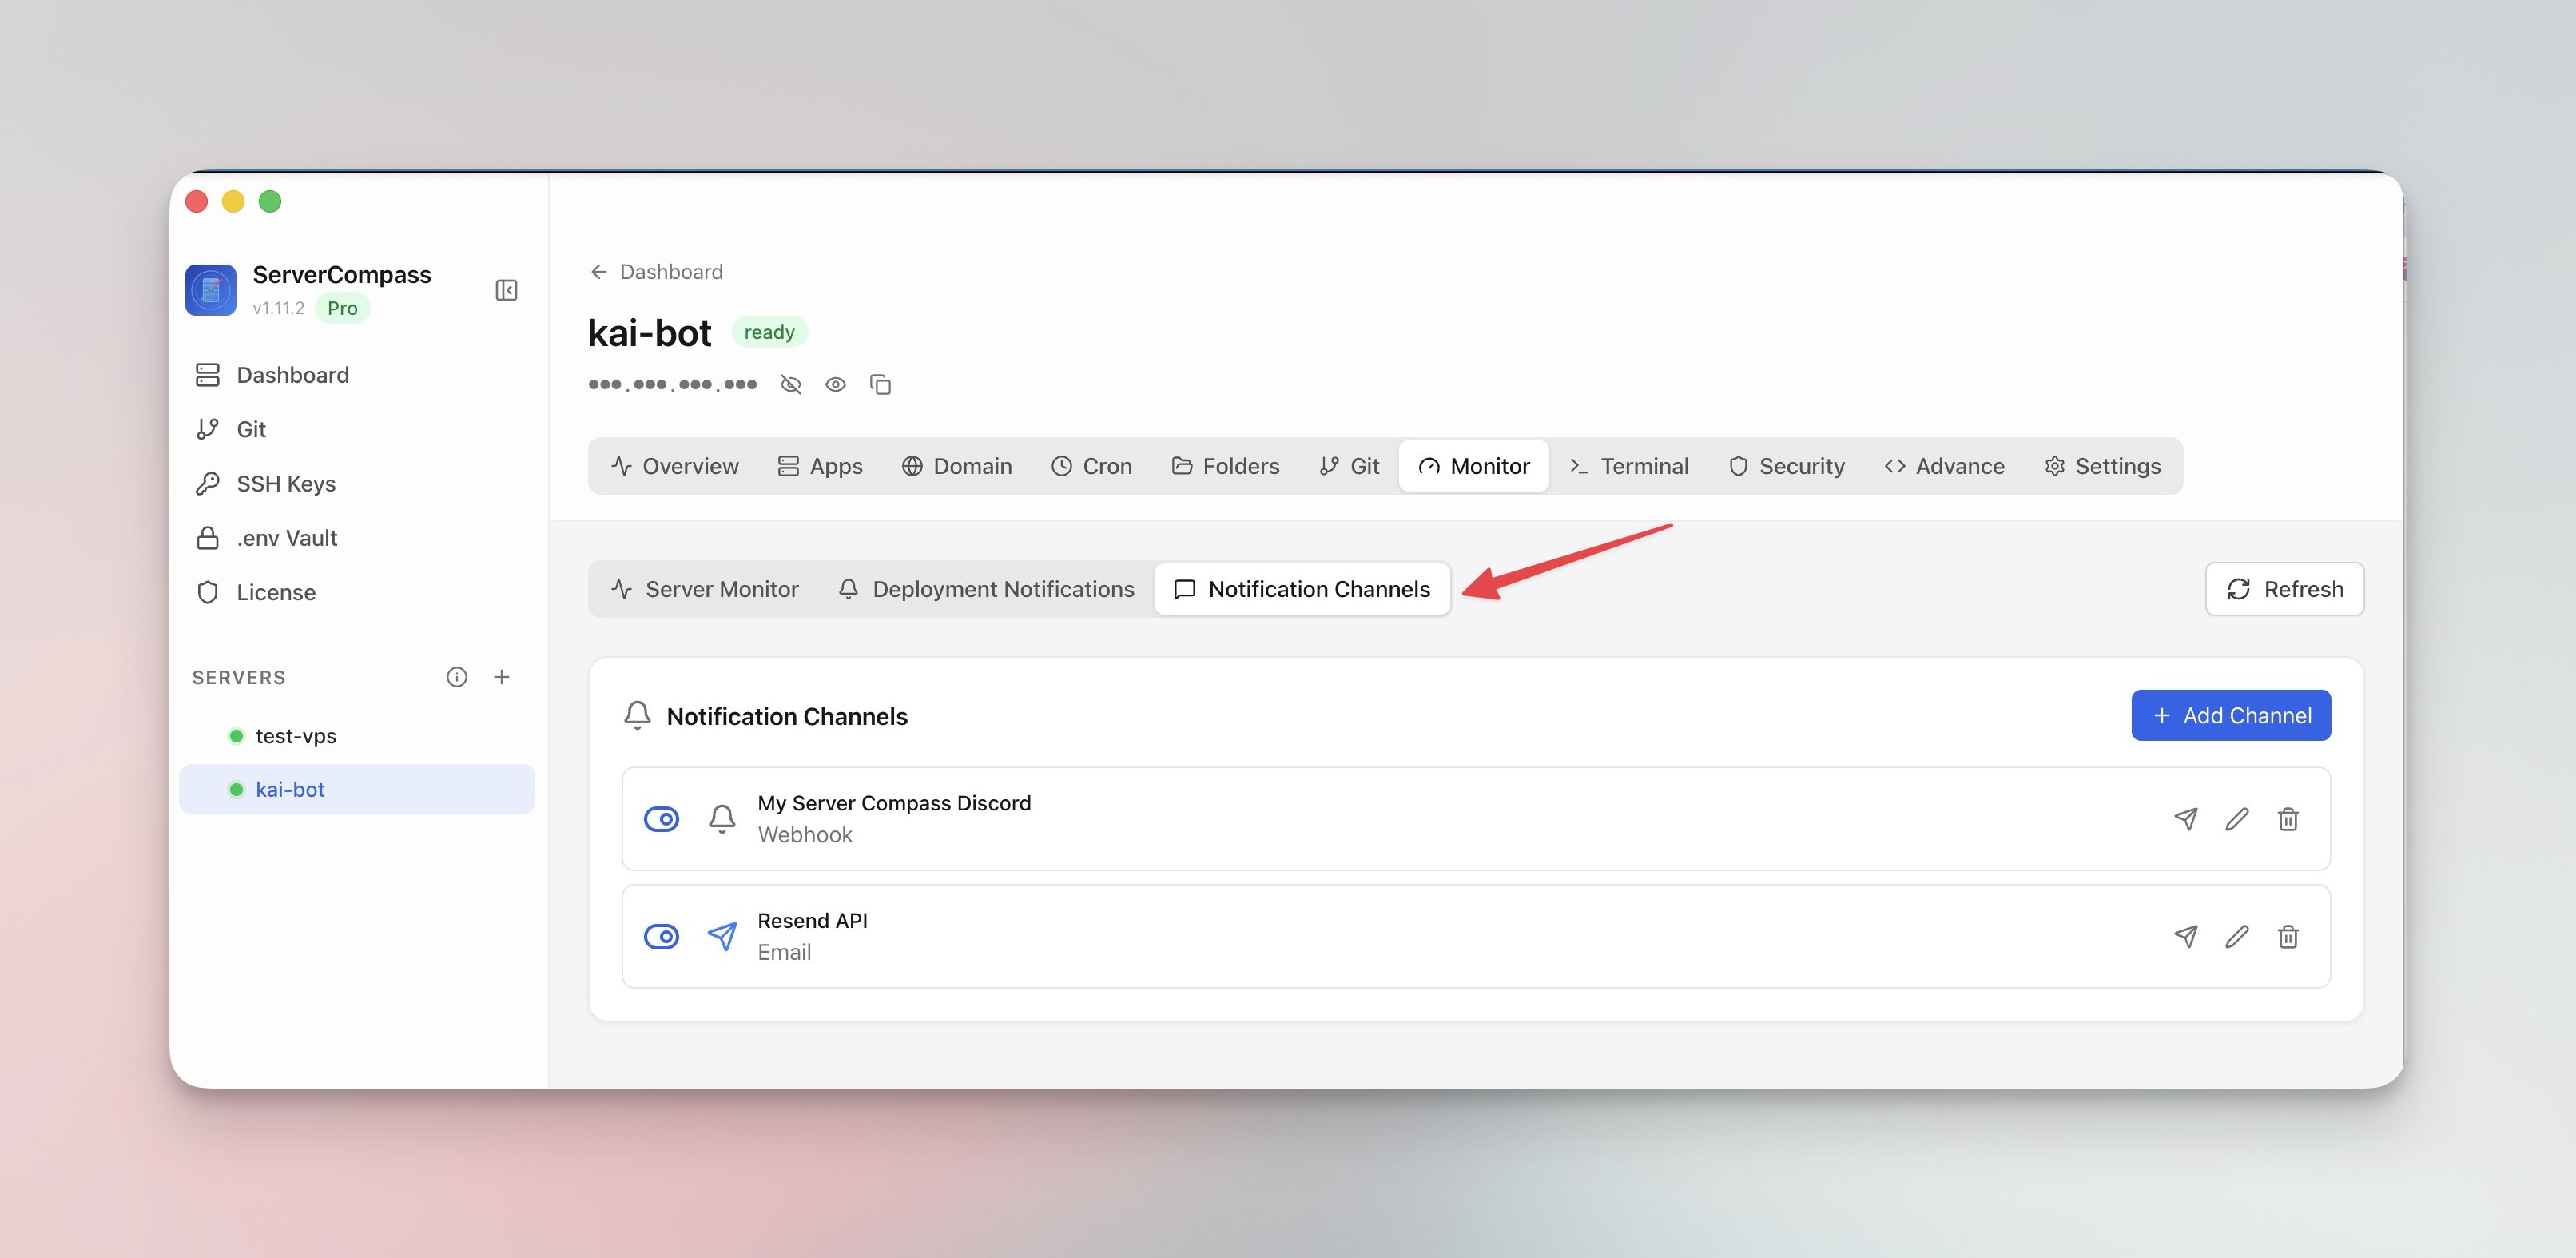
Configure notification channels in Server Compass and send a test alert before relying on them. A broken notification channel is just another silent failure.
6. Run one monthly incident drill
Monitoring is not done when the dashboard is green. Once a month, run a small drill:
- Trigger a test alert and confirm delivery.
- Restart one non-critical container and verify the expected status change.
- Check one backup and confirm it can be restored or inspected.
- Review SSL expiry dates for production domains.
- Open recent activity logs and confirm destructive operations are auditable.
The drill takes less than 20 minutes, but it catches the exact configuration drift that makes real incidents painful.
Common mistakes
- Monitoring too much first: start with availability, disk, memory, SSL, and restarts.
- No severity levels: every alert cannot be urgent or you will ignore all of them.
- No restore test: a backup that has never been restored is only a hope.
- Only checking the server: outside-in checks catch proxy, DNS, and certificate failures.
The 15-minute baseline
Install the monitoring agent, add alert rules for disk/RAM/container restarts, verify SSL expiry, route alerts to a channel you watch, and run one test notification. That baseline will not replace a full observability stack, but it will stop users from becoming your monitoring system.
FAQ
What should I monitor on a self-hosted VPS?
Monitor public uptime, Docker container status, CPU, memory, disk usage, SSL certificate expiry, deployment failures, and database reachability. Add deeper application metrics only after those basics are reliable.
Do I need Prometheus and Grafana for one VPS?
Not immediately. Prometheus and Grafana are useful when you need historical dashboards and custom metrics, but a small VPS can start with uptime checks, resource alerts, log access, and notification channels.
How do I get Docker container alerts?
Alert on unexpected restarts, unhealthy containers, high memory usage, and disk pressure. Server Compass surfaces container health and resource usage without requiring you to SSH into the VPS and inspect docker ps manually.
Download Server Compass and set up the monitoring baseline before the next 2 AM surprise.
Related in the StoicSoft network
If you're self-hosting on a VPS or working through a deployment guide like the one above, DeployToVPS is the StoicSoft network's handbook for VPS deployment recipes — docker-compose, nginx, traefik, and common app self-hosts.
From across the StoicSoft network
Hand-curated reads on the same topic from sister sites in the StoicSoft family.
 1DevTool11 min read
Self-Hosted AI Coding Assistant Workflow: Practical Setup Guide
A self-hosted AI coding workflow needs more than model hosting. You need environment control, connector governance, and reproducible operations. This guide covers the practical stack.
Read on 1devtool.com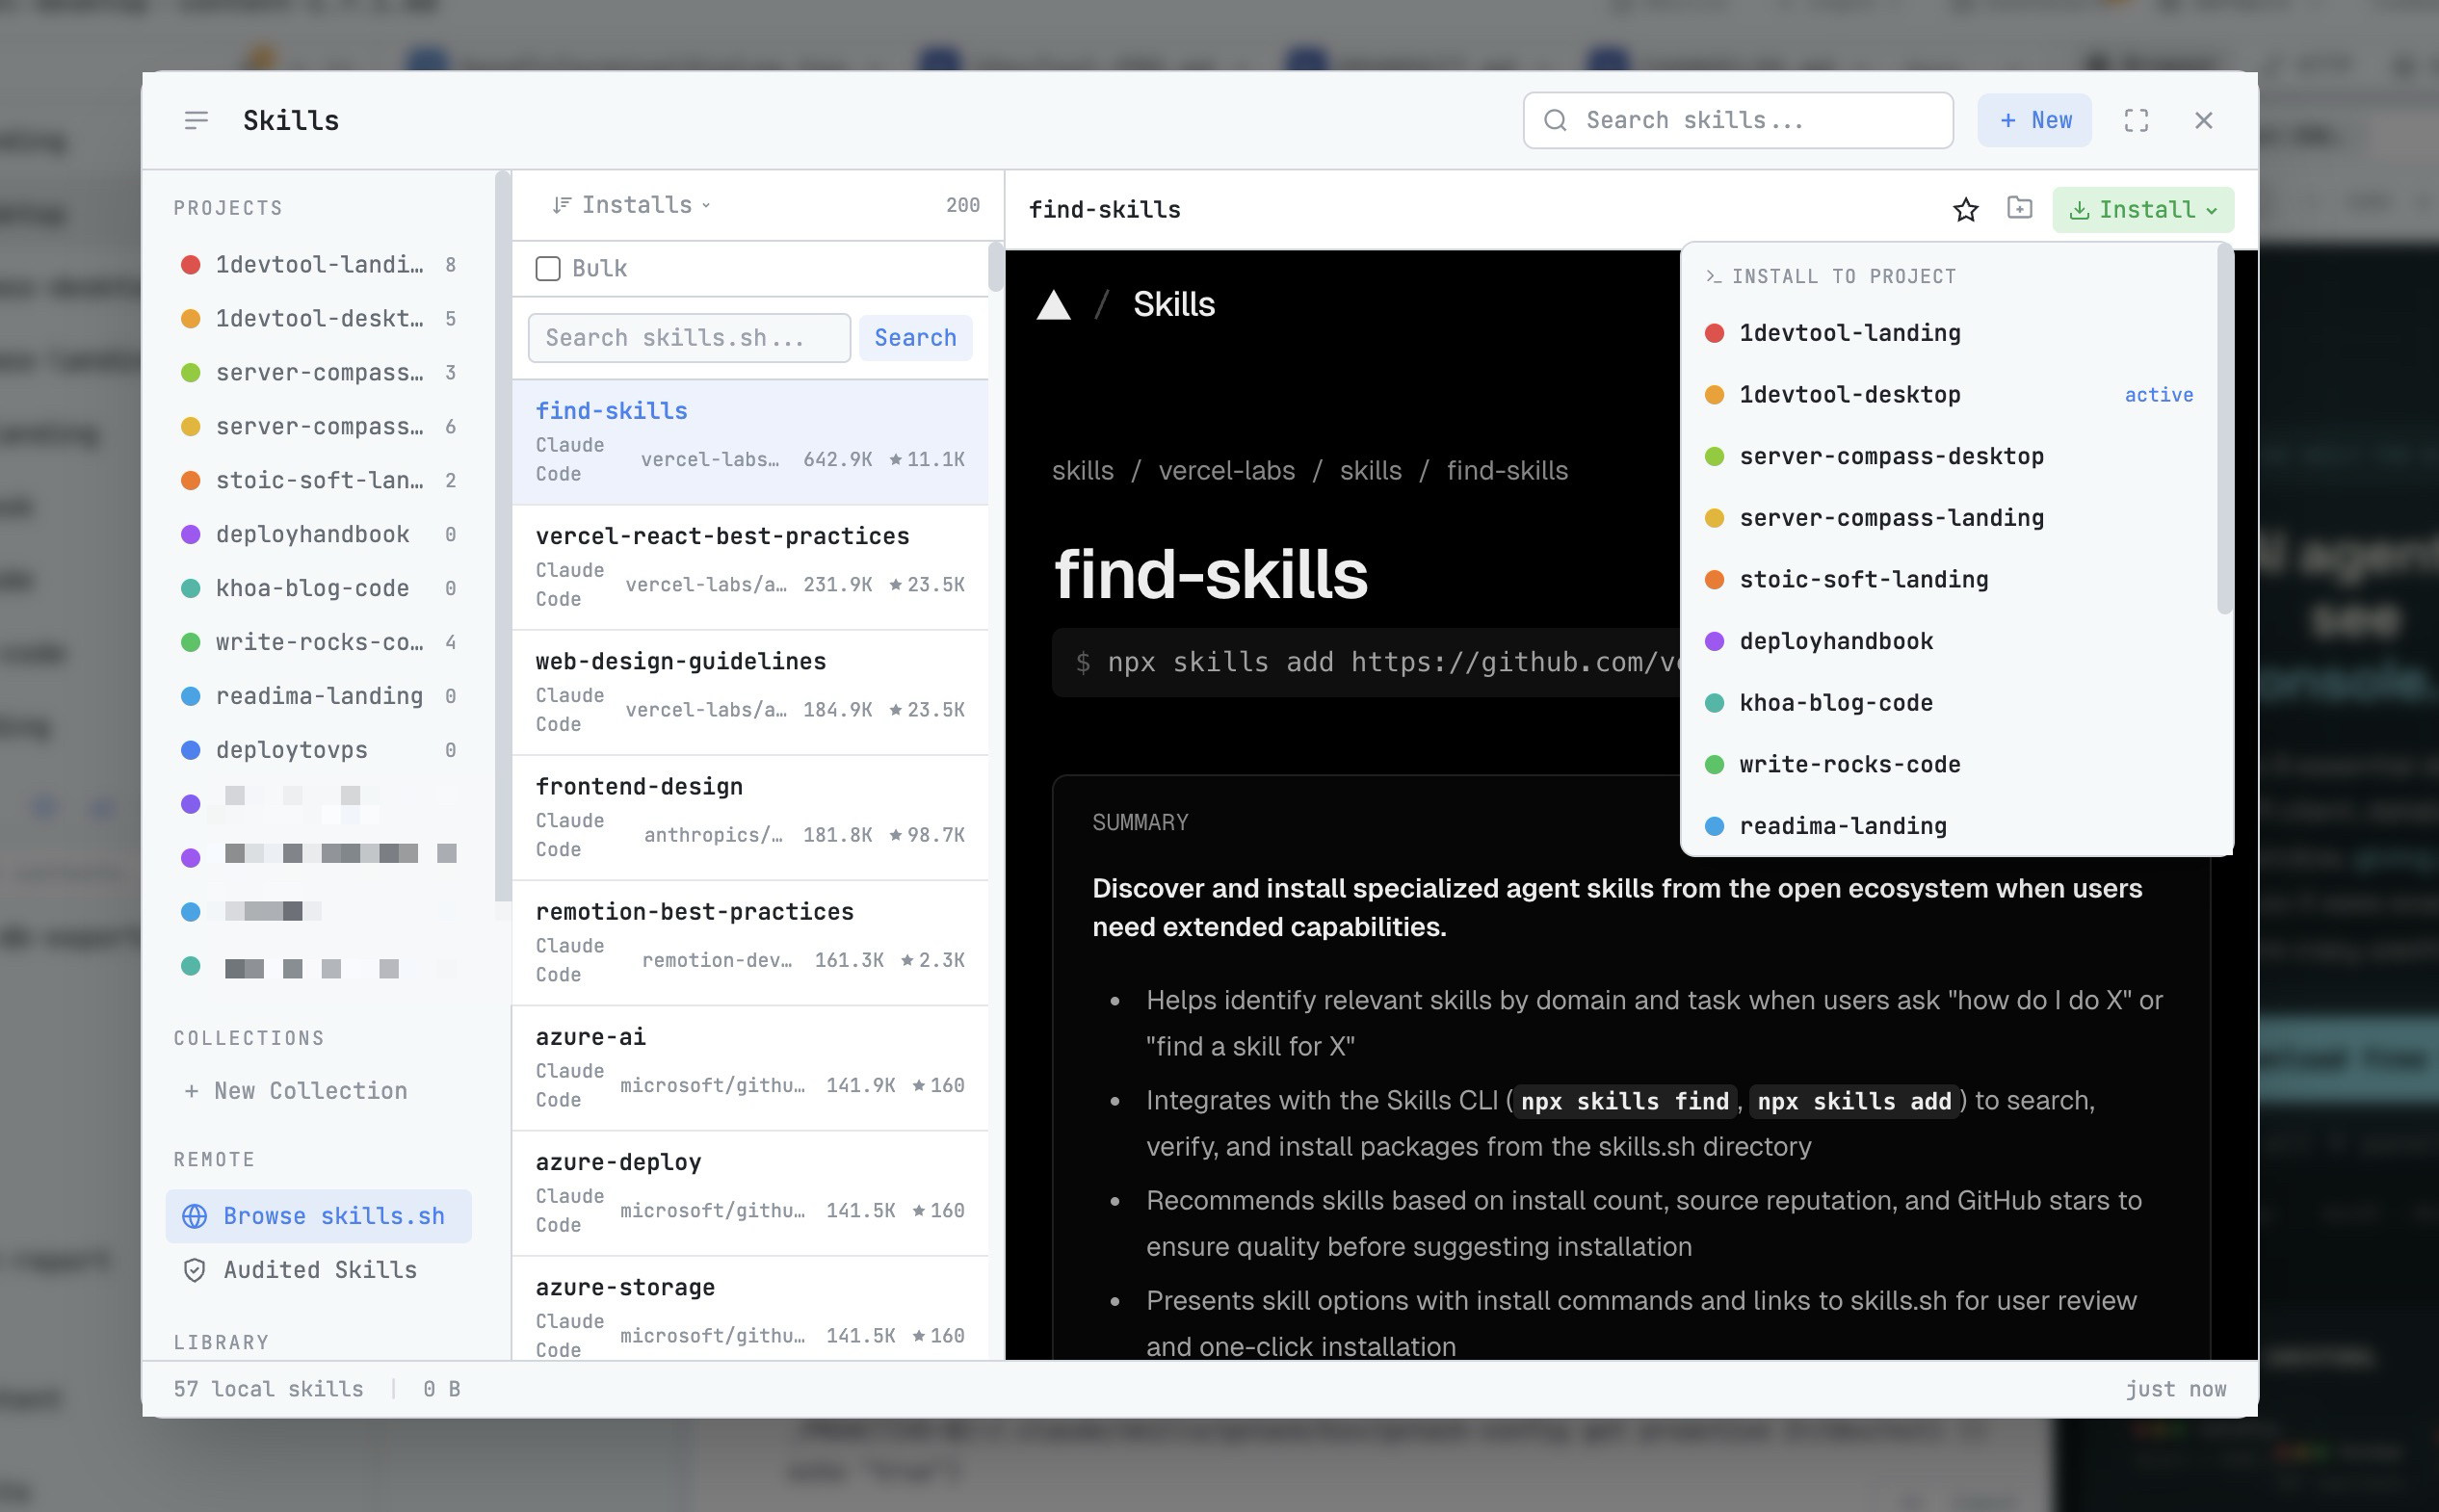 1DevTool8 min read
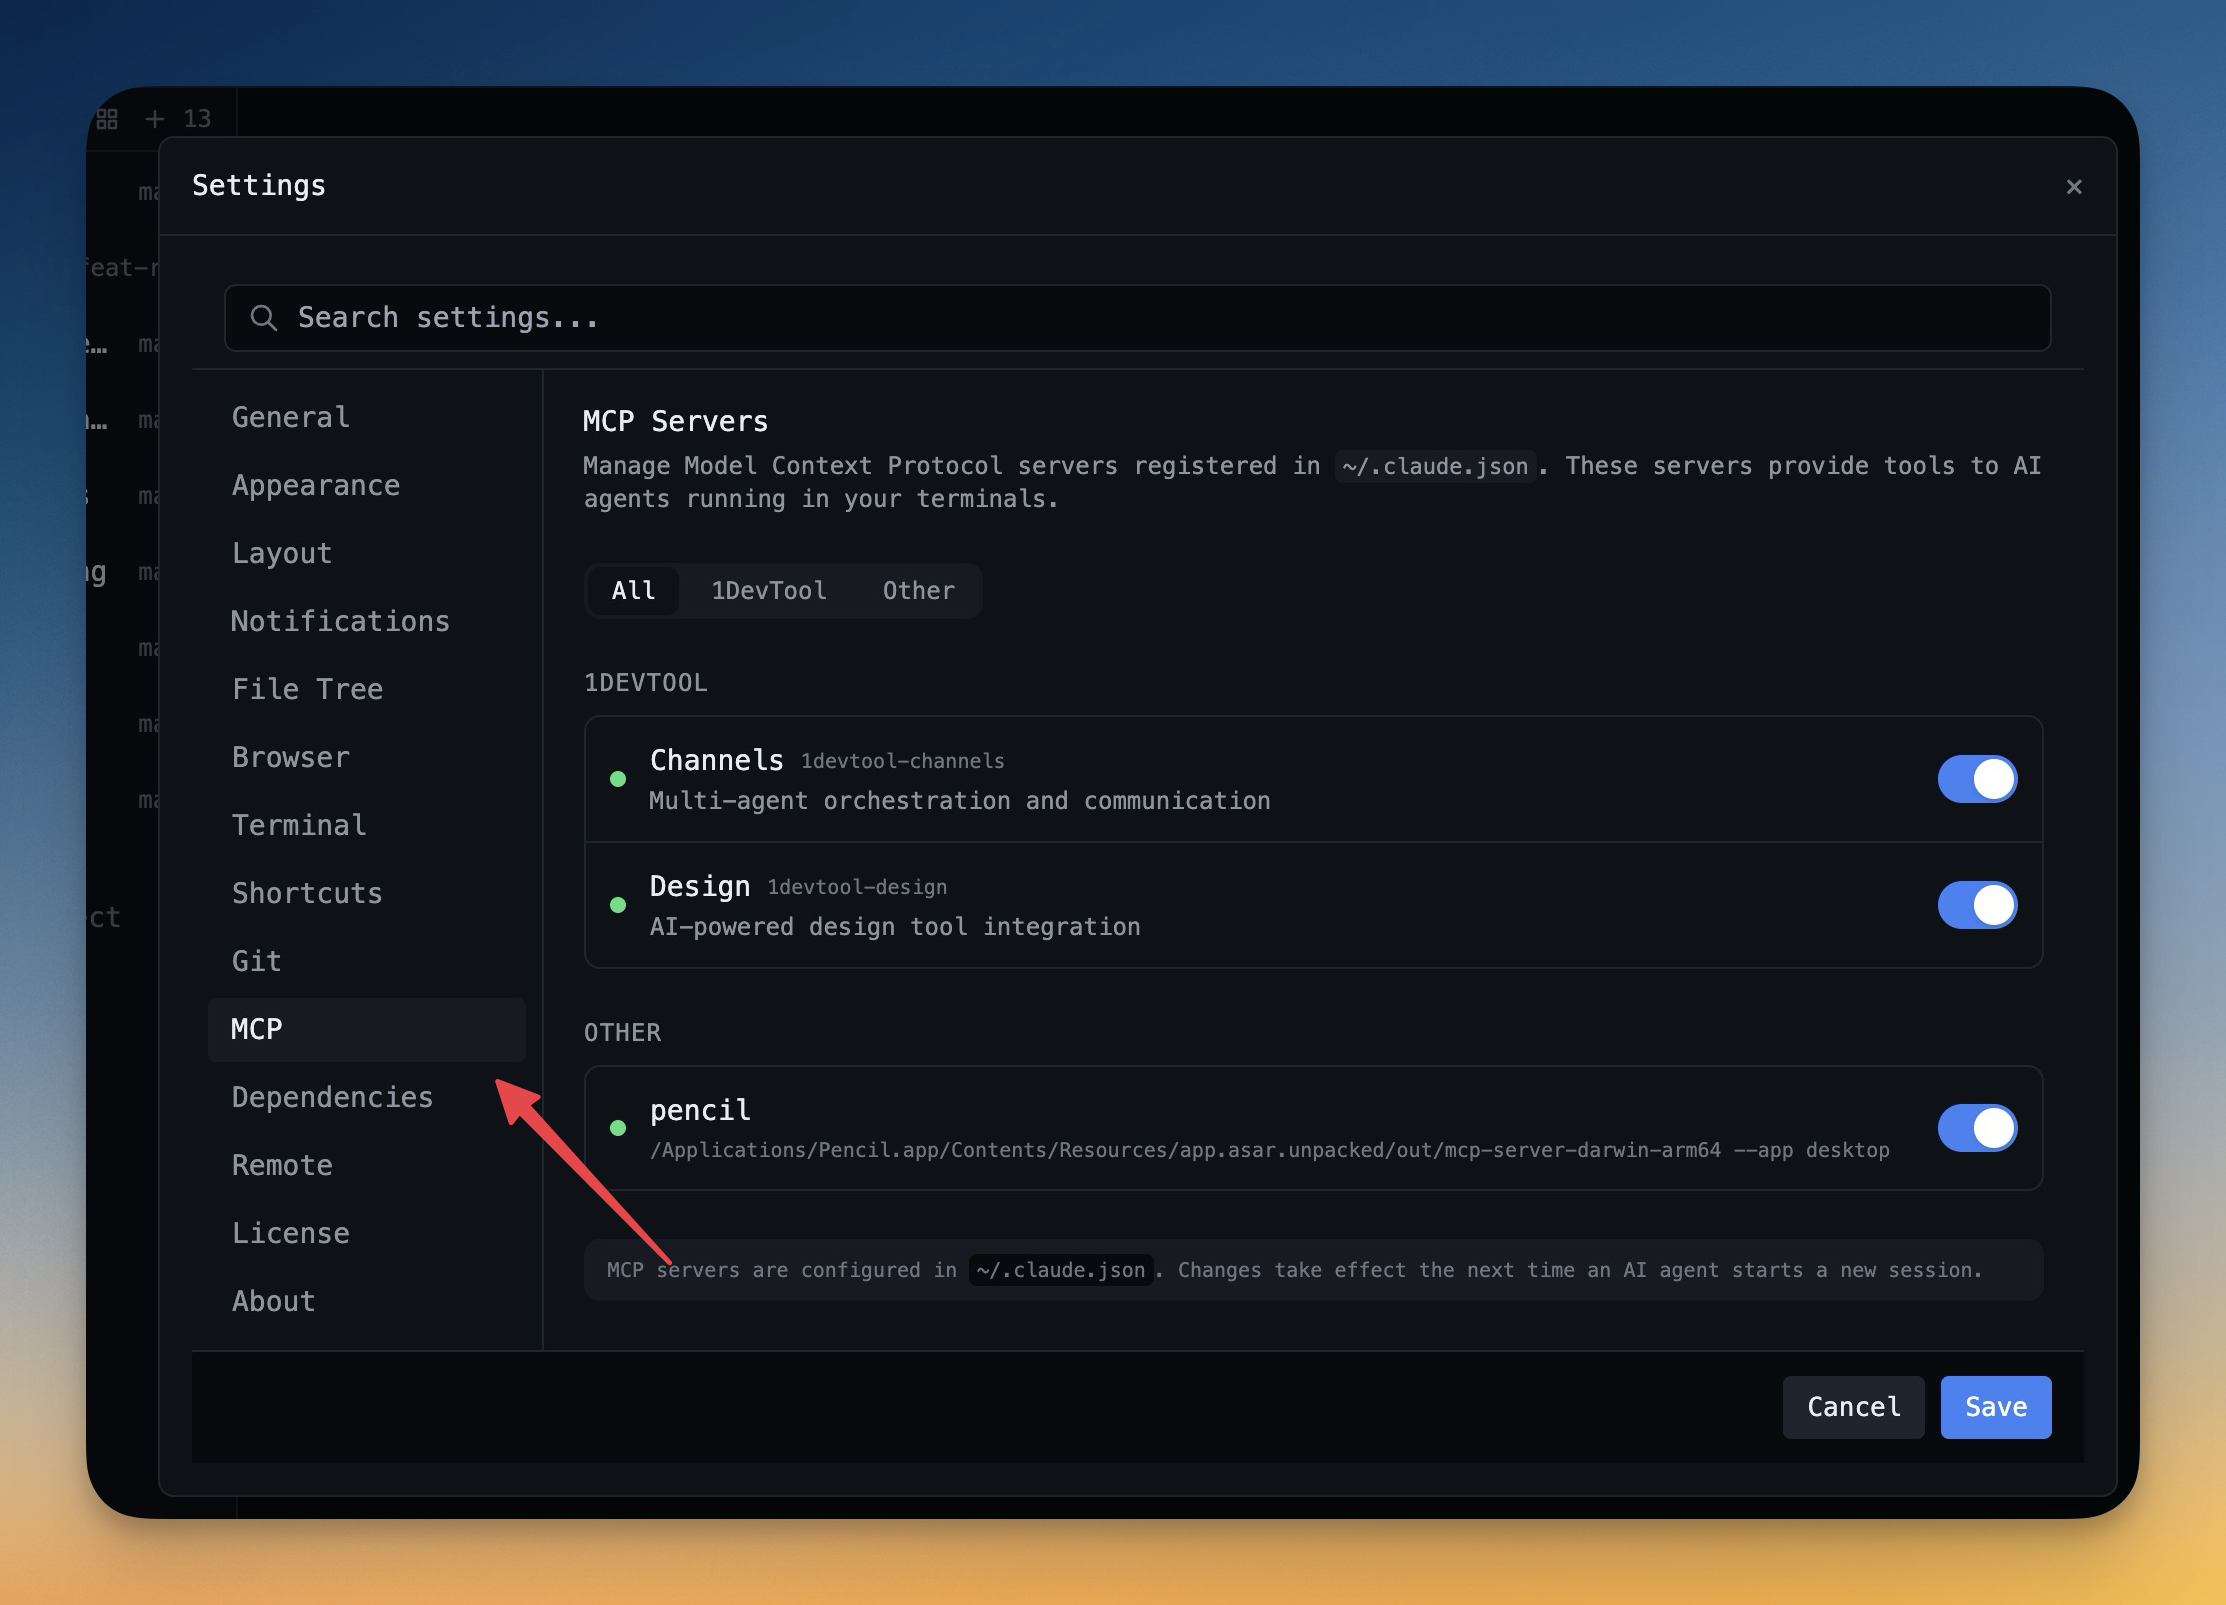
AI Skills Manager & Docker Deep Dive: Extend Your Agents, Monitor Your Containers
Browse, create, and install AI agent skills with built-in security scanning. Plus a redesigned Docker manager with live CPU, memory, and network monitoring for every container.
Read on 1devtool.com