Network Health
Diagnose your VPS Docker networking in one view — spot missing links, broken memberships, and orphaned ghost networks for connected apps, then clean up unused networks in a single click.
Using Network Health in Server Compass
Network Health replaces complex workflows with a few clicks. Here's the process.
Open View Network Health
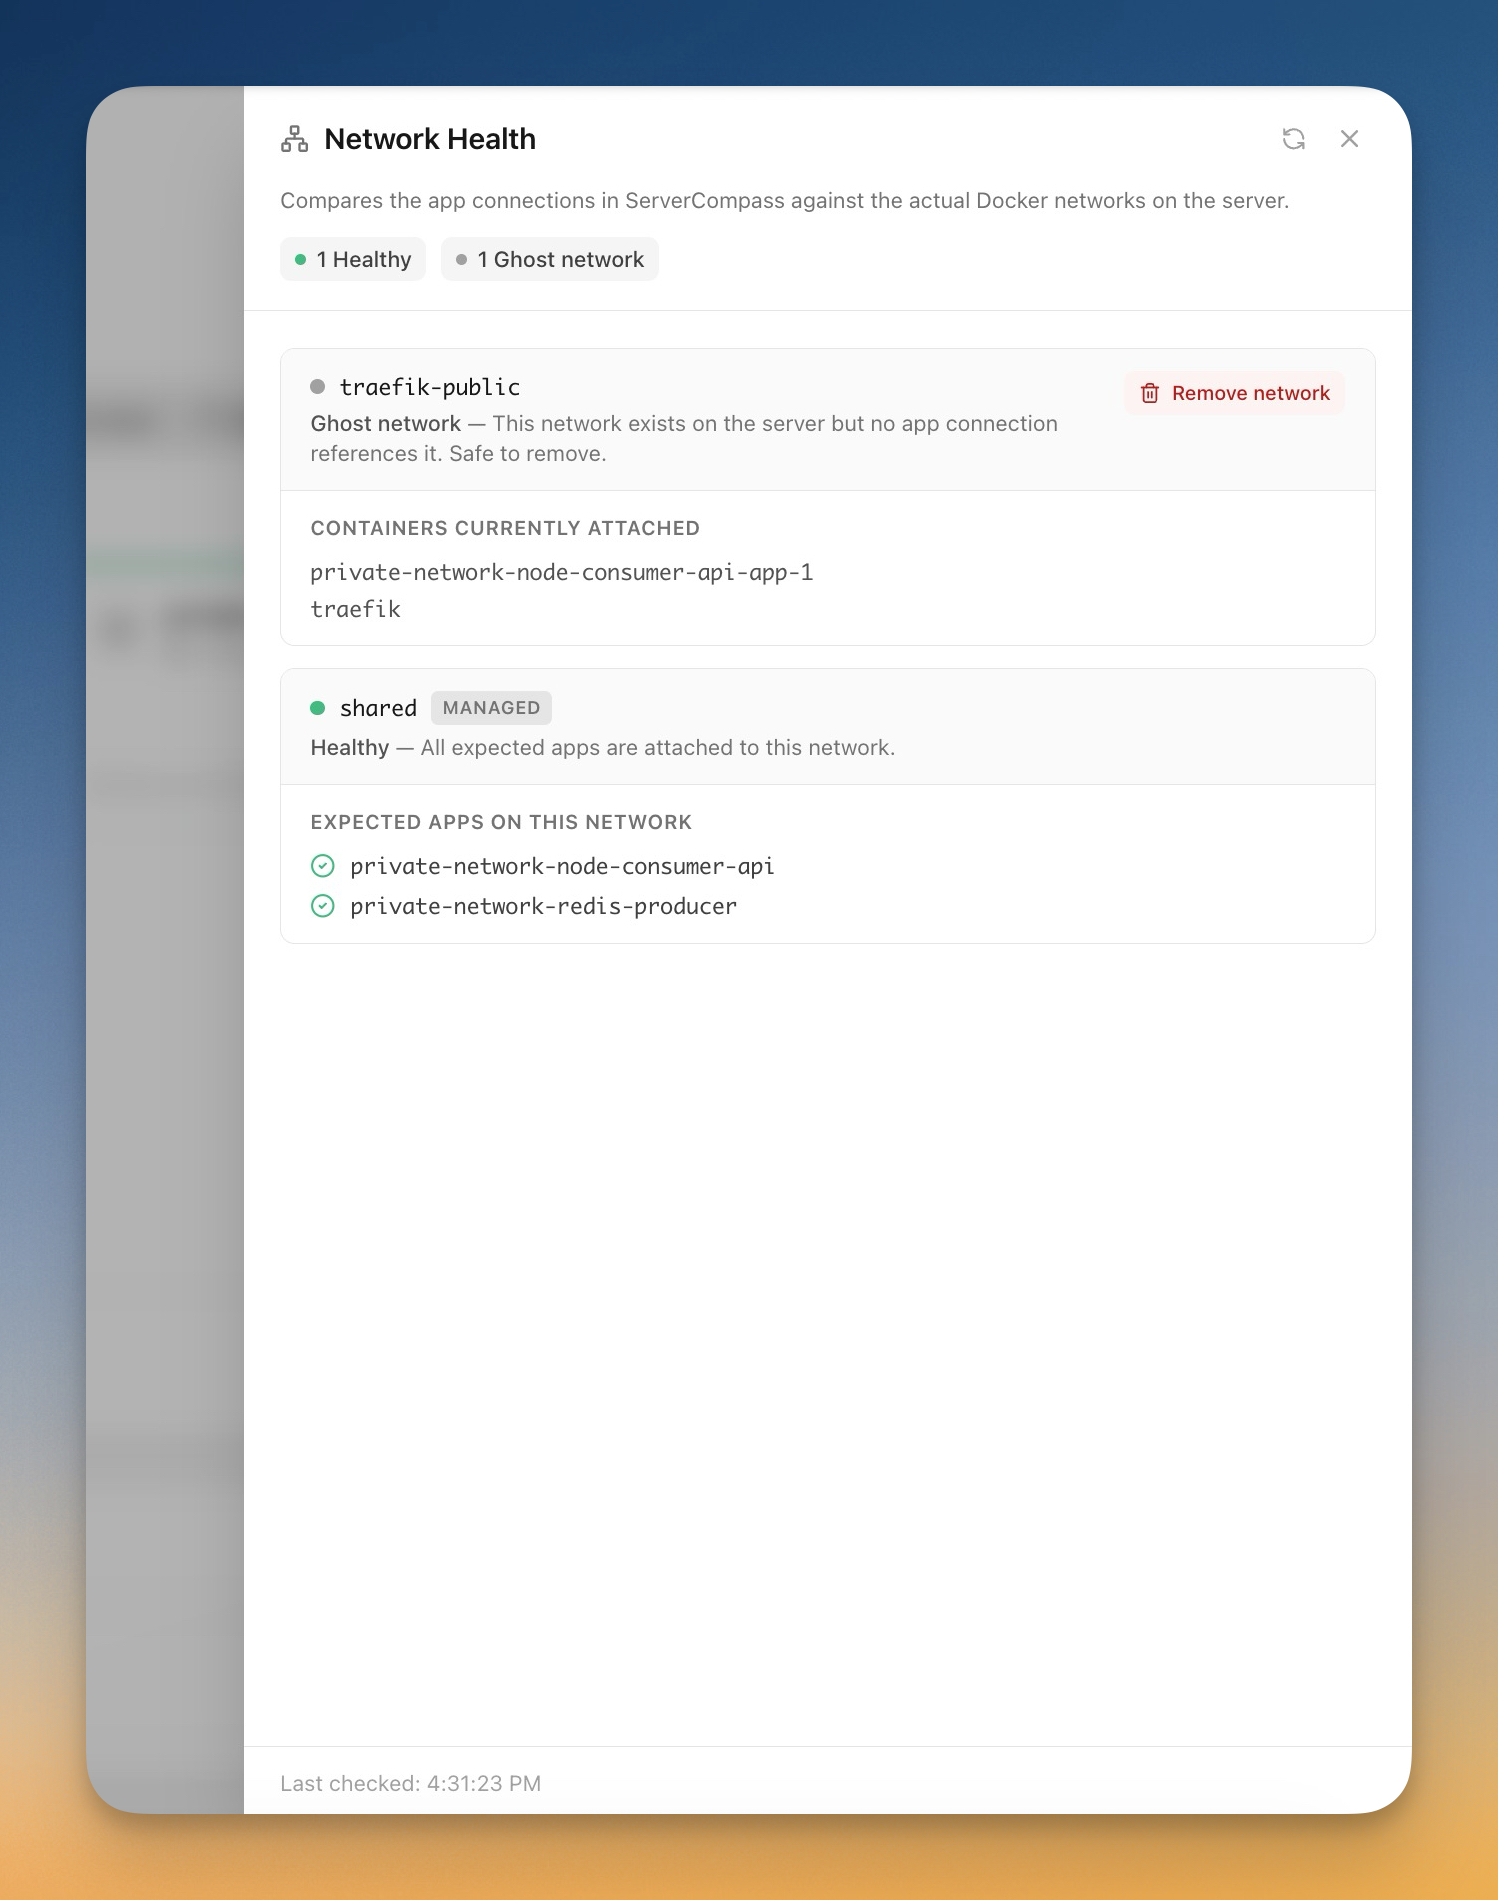
From the server's App Connections panel, click View Network Health. Server Compass runs docker network ls and docker network inspect under the hood.
Read each network status
Healthy means every expected app is attached. Membership broken means some expected projects aren't on the network. Missing means an app_connection points to a network that no longer exists. Ghost means a server-side network has no app_connection referencing it.
Diagnose membership issues
For non-healthy networks, the sheet lists actual attached containers next to expected stacks. Comparing the two tells you which apps need a redeploy to re-attach.
Remove ghost networks
Each ghost gets a Remove network button that runs docker network rm. Networks still referenced by an active connection are blocked with a clear message — unlink first.
Doing It Manually Without Network Health
Think Network Health is overkill? Here's the alternative: raw terminal commands and manual config files.
SSH into your server
There is no GUI for inspecting Docker networks. Everything starts at the shell.
ssh root@your-server-ipList every network and figure out which ones matter
Half the names are compose defaults. The other half might be ghosts. There is no flag for "show me only the ones I created on purpose."
docker network ls

# Output looks like:
# NETWORK ID     NAME                DRIVER    SCOPE
# 2f3a8c8d3a01   bridge              bridge    local
# 8c91b1c39e10   host                host      local
# 4d2a91e0f4e2   none                null      local
# a1b2c3d4e5f6   myapp_default       bridge    local
# 7e8d9c0a1b2c   shared              bridge    local
# 9f0e1d2c3b4a   stale-old-network   bridge    local   <-- ghost? in use? who knows
Without a paper trail, you cannot tell at a glance which networks are still wired to running apps.
Inspect each network to see what is attached
For every non-system network, run inspect and read through the JSON to find the Containers block.
docker network inspect shared --format '{{range $id, $c := .Containers}}{{$c.Name}}{{"\n"}}{{end}}'

# myapp-api-1
# myapp-redis-1

# Repeat for every network you might want to clean up.
# Match container names back to compose projects by string-matching prefixes.
# (Yes, that's the actual heuristic.)Decide if a network is safe to remove
No connection list, no membership check, no audit. You just have to be sure.
# Cross-reference everything you found:
# 1. Network has zero containers? Probably ghost. Probably.
# 2. Network has containers from one project but you expected two? Membership broken.
# 3. Network appears in a compose file but not in 'docker network ls'? Missing.

# Now hope you got it right before you run:
docker network rm stale-old-network
Remove the wrong one and the next redeploy fails with "network not found." Restoring it means recreating it under the same name and re-attaching every affected container.
Repeat every time anything changes
New app deployed, app deleted, container restarted, manual `docker compose up` outside your usual flow — any of these can shift the picture. There is no notification.
# Re-run all of the above. Periodically.
# Or wait for production to break and figure it out then.
This whole loop is theater unless you do it consistently. Most people do it once, then never again, then ghost networks pile up.
Let Server Compass Handle It
Server Compass replaces all those commands with a beautiful UI. Network Health just works—click, configure, done.
- Visual interface
- No terminal needed
- Built-in error handling
- Works on any VPS
Everything Network Health Offers
Everything you need for server management in one integrated tool, replacing complex CLI commands and manual configuration.
Get StartedWhy Network Health Matters
Server management shouldn't require a DevOps team. Network Health makes professional-grade server management accessible to everyone.
At-a-Glance Monitoring
Network Health shows CPU, RAM, disk, and network metrics in a single dashboard view.
Quick Actions
Network Health provides one-click package updates, Docker setup, and system configuration.
Multi-Server Support
Network Health manages unlimited VPS servers from one application with saved connections.
Resource Trending
Network Health tracks resource usage over time so you can plan capacity and identify bottlenecks.
Common Questions About Network Health
Common questions about Network Health in Server Compass
How do I access Network Health in Server Compass?
Network Health is available in the Server Management section of Server Compass. Simply connect to your server, navigate to Server Management, and you'll find Network Health ready to use. No additional setup or plugins required.
Does Network Health require any server-side installation?
No. Server Compass operates as a desktop application that connects to your server via SSH. Network Health works through this connection without installing any agents or packages on your server (except the optional monitoring agent for resource tracking).
Is Network Health included in all Server Compass plans?
Yes. Every Server Compass feature, including Network Health, is included with the one-time $29 payment. There are no tier restrictions, add-ons, or per-server fees. You get all 125+ features for all your servers.
Can I use Network Health with any VPS provider?
Network Health works with any VPS or dedicated server that supports SSH access and Docker. This includes DigitalOcean, Hetzner, Vultr, Linode, AWS EC2, Google Cloud, Azure, and any other provider. It also works with local servers and homelab setups.
What makes Network Health different from command-line alternatives?
Network Health provides a visual, intuitive interface that replaces complex CLI commands and configuration files. You get real-time feedback, safety confirmations, and a consistent experience across all your servers without memorizing syntax or writing scripts.
More Server Management Features
Explore other server management capabilities in Server Compass
Server Overview Dashboard
At-a-glance view of CPU, RAM, and disk usage. See OS info, auth method, location, and provider details.
Resource Monitoring
Real-time CPU, memory, and disk usage graphs. Track resource trends and identify bottlenecks.
System Packages
List and manage installed system packages. Update individual packages or perform system-wide upgrades.
Port Management
View all open ports and the services using them. Identify conflicts and manage port allocations.
Try Network Health Today
Download Server Compass and get access to Network Health along with 124 other features. One-time $29 payment. No subscriptions. No per-server fees.