1
Step 1Open the server Apps tab
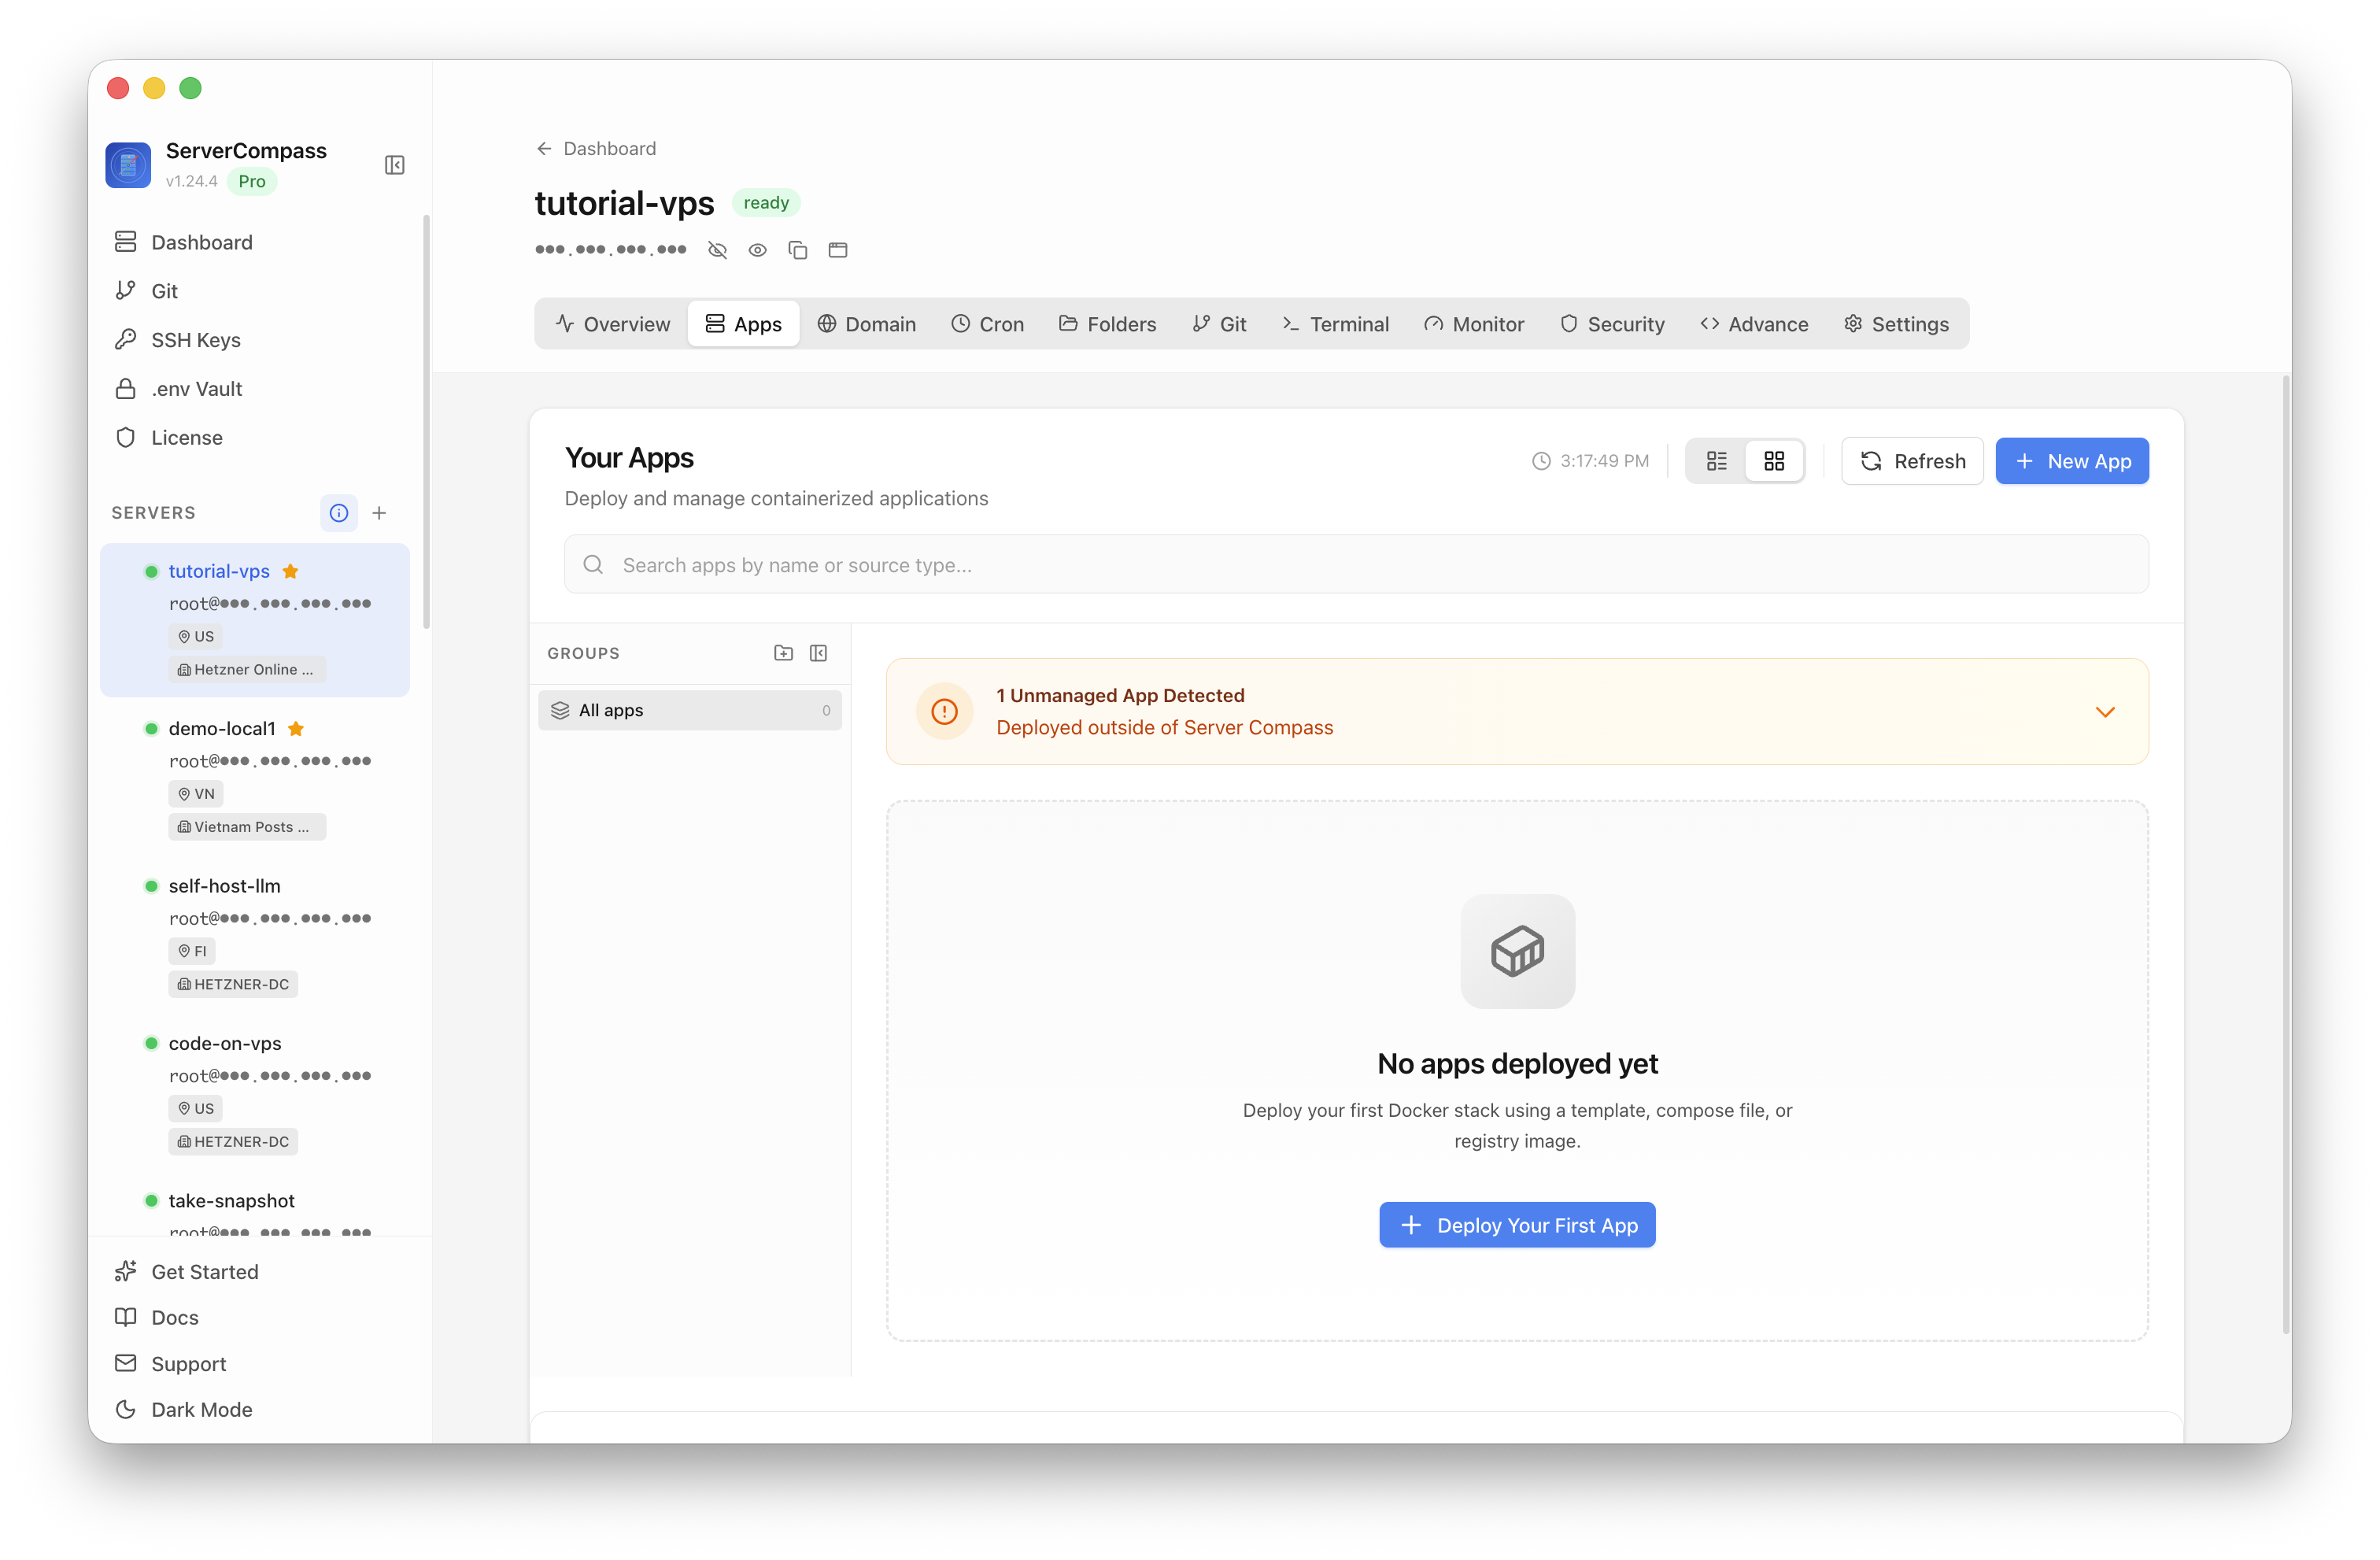
Select your VPS, open the Apps tab, and start a new app deployment. Keep sensitive server details hidden before capturing or sharing screenshots.

Time-series monitoring and alerting system
Add your server credentials to Server Compass
Choose from our template library
Fill in settings and click Deploy
Use the Prometheus template in Server Compass to deploy a self-hosted monitoring and time-series metrics server on your VPS, then verify the Prometheus query UI in a browser.
Select your VPS, open the Apps tab, and start a new app deployment. Keep sensitive server details hidden before capturing or sharing screenshots.
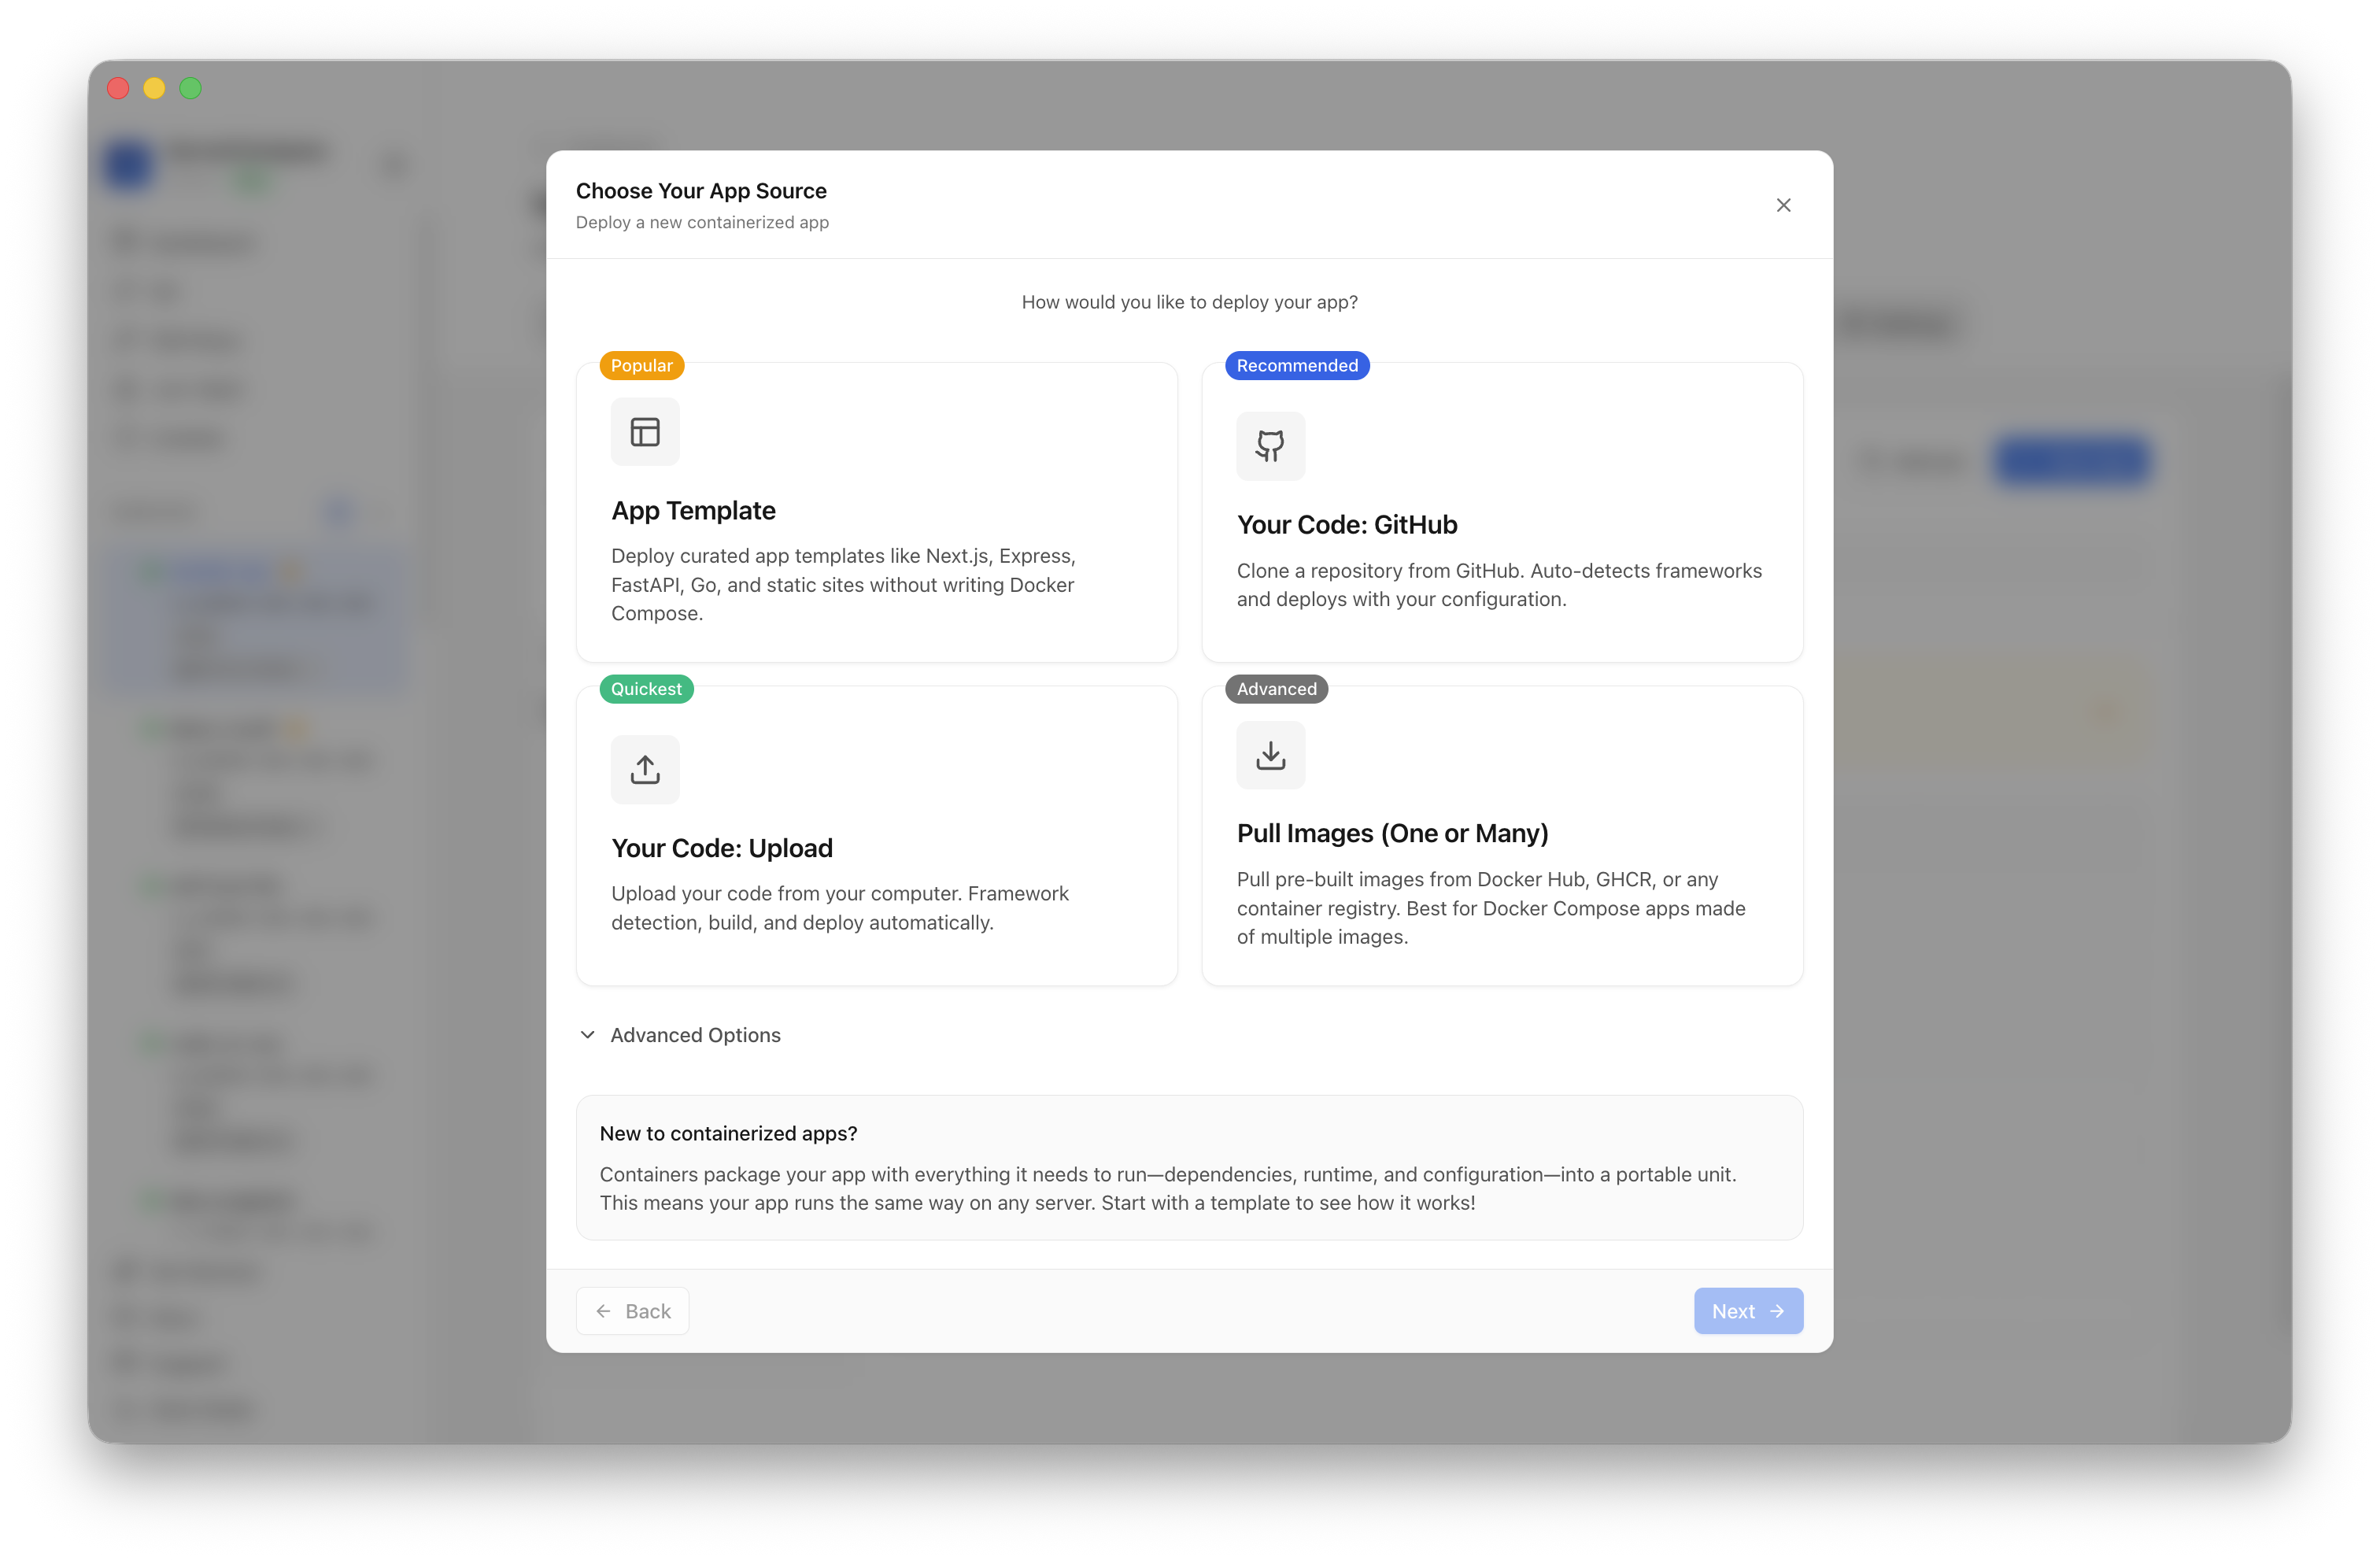
Click New App and choose the template deployment path so Server Compass can load the built-in catalog.
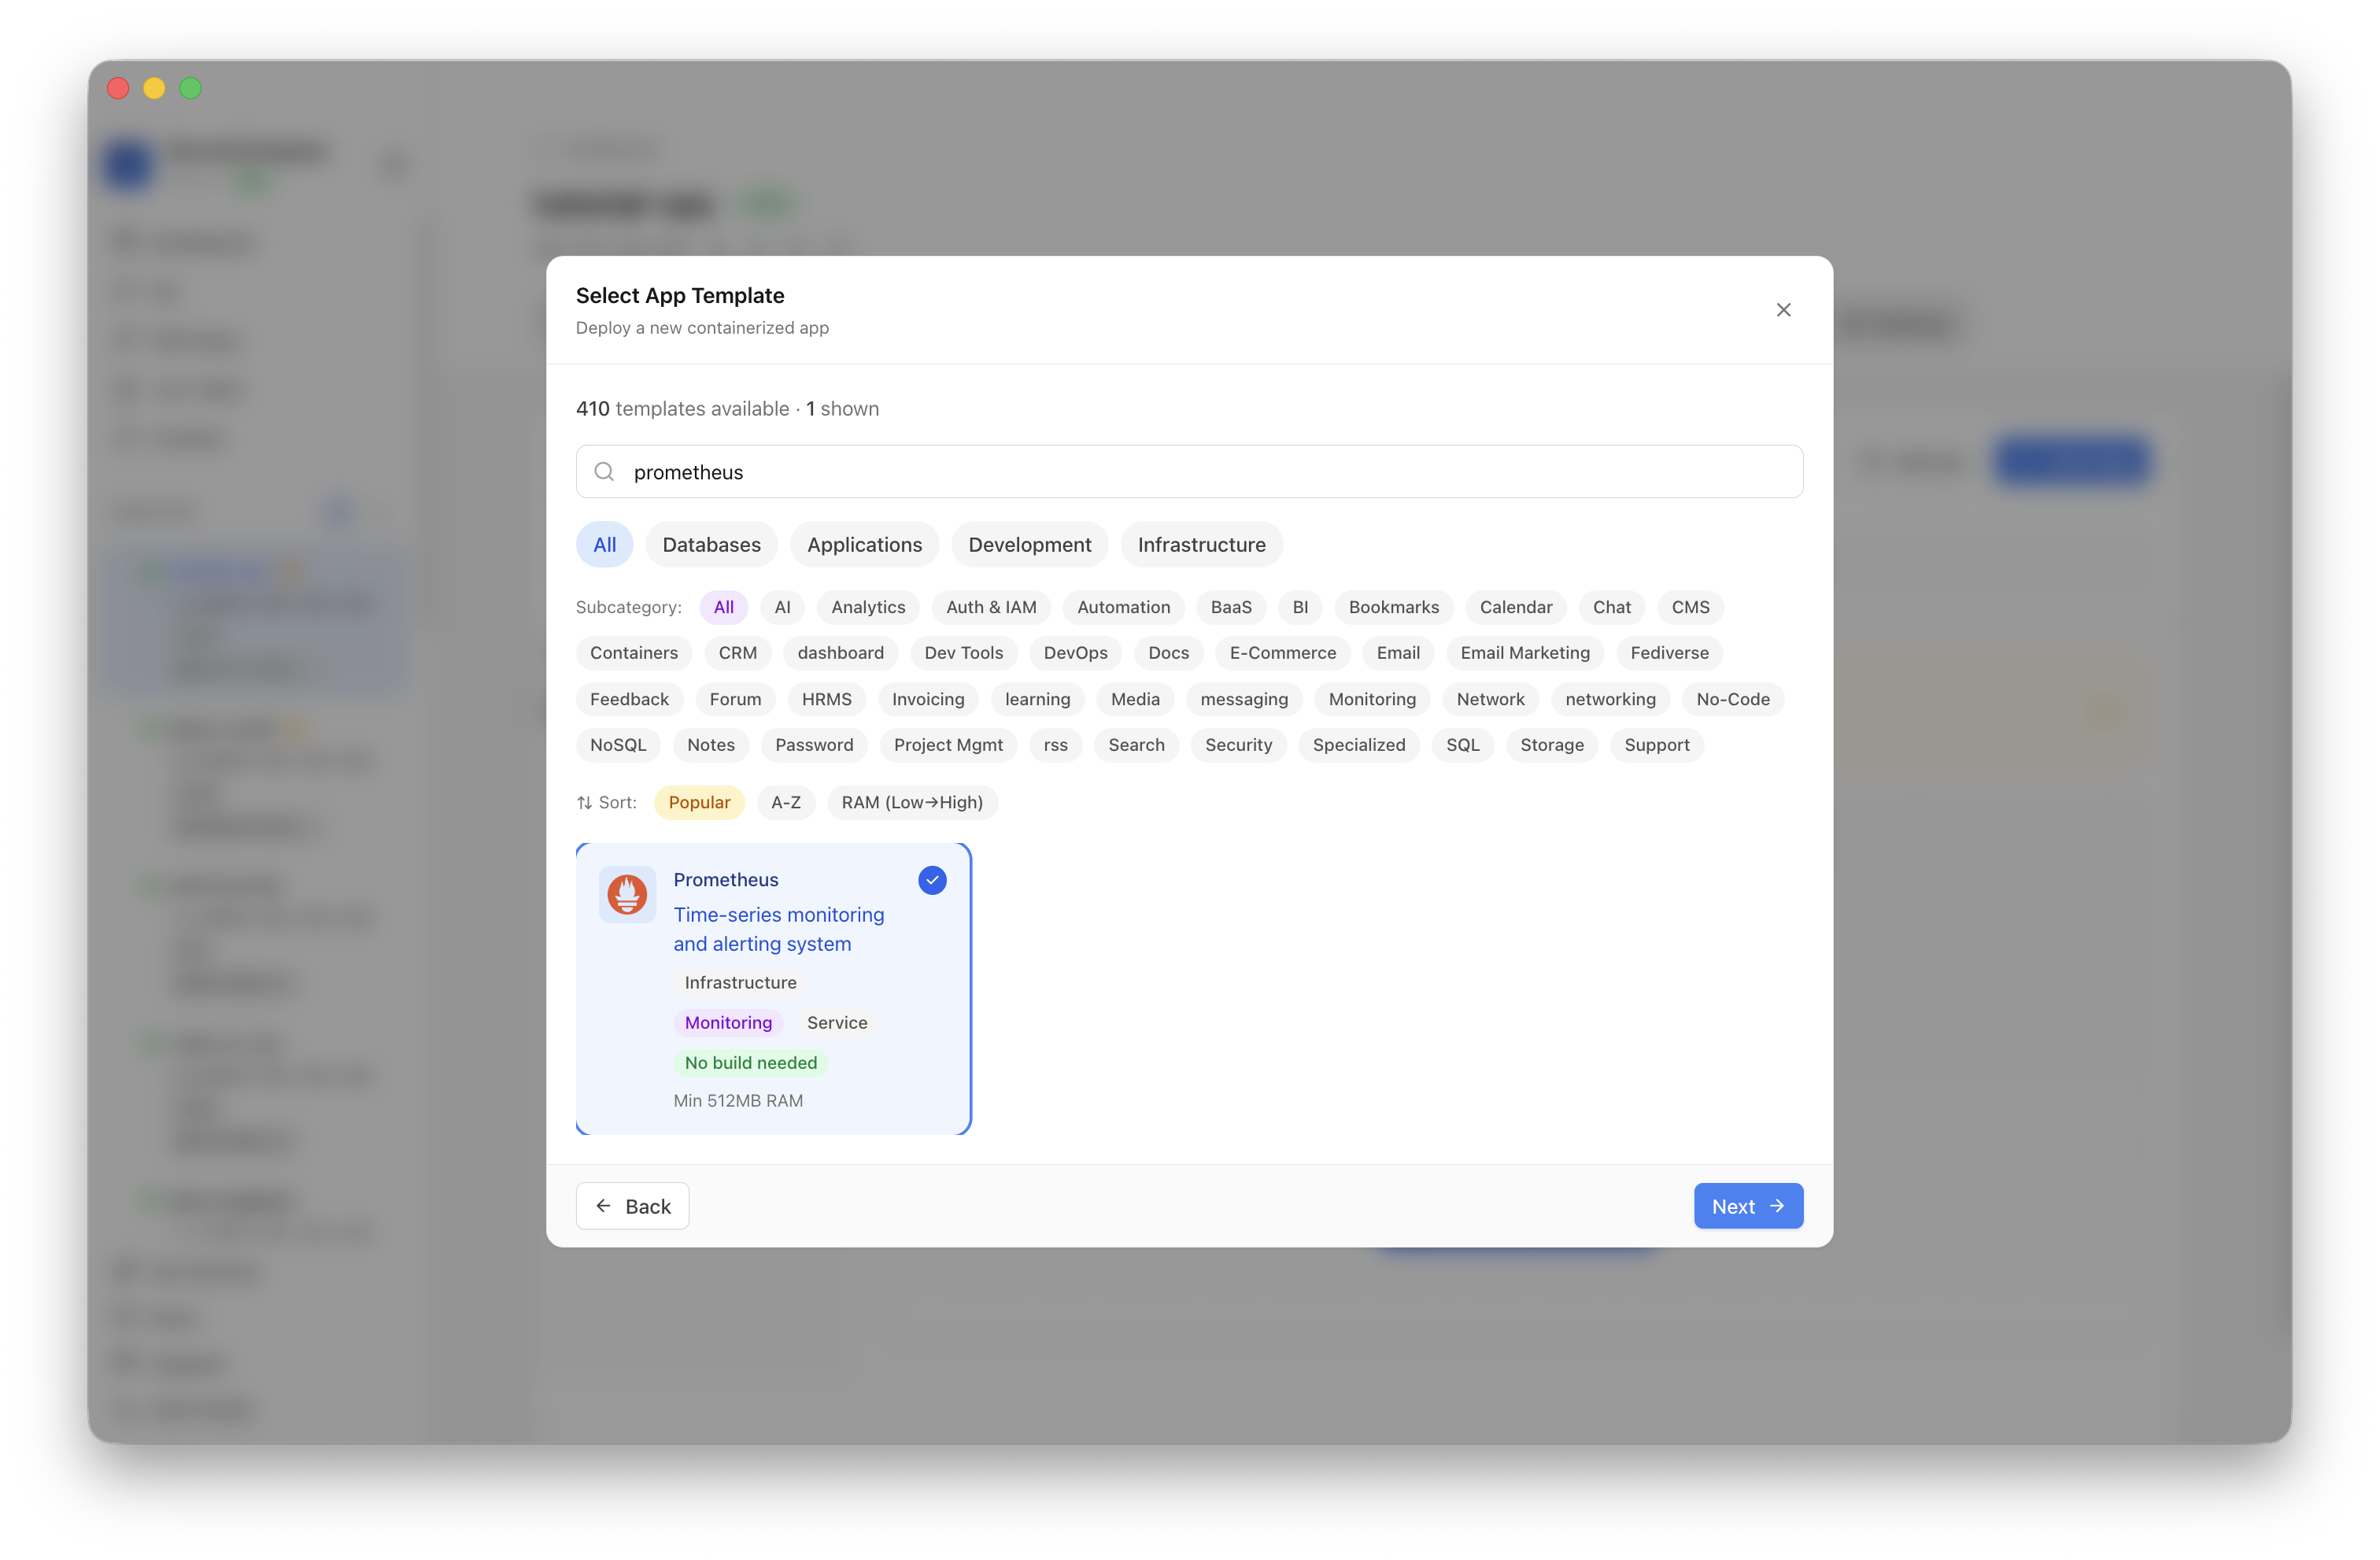
Use the template picker search to find Prometheus in the Server Compass template catalog.
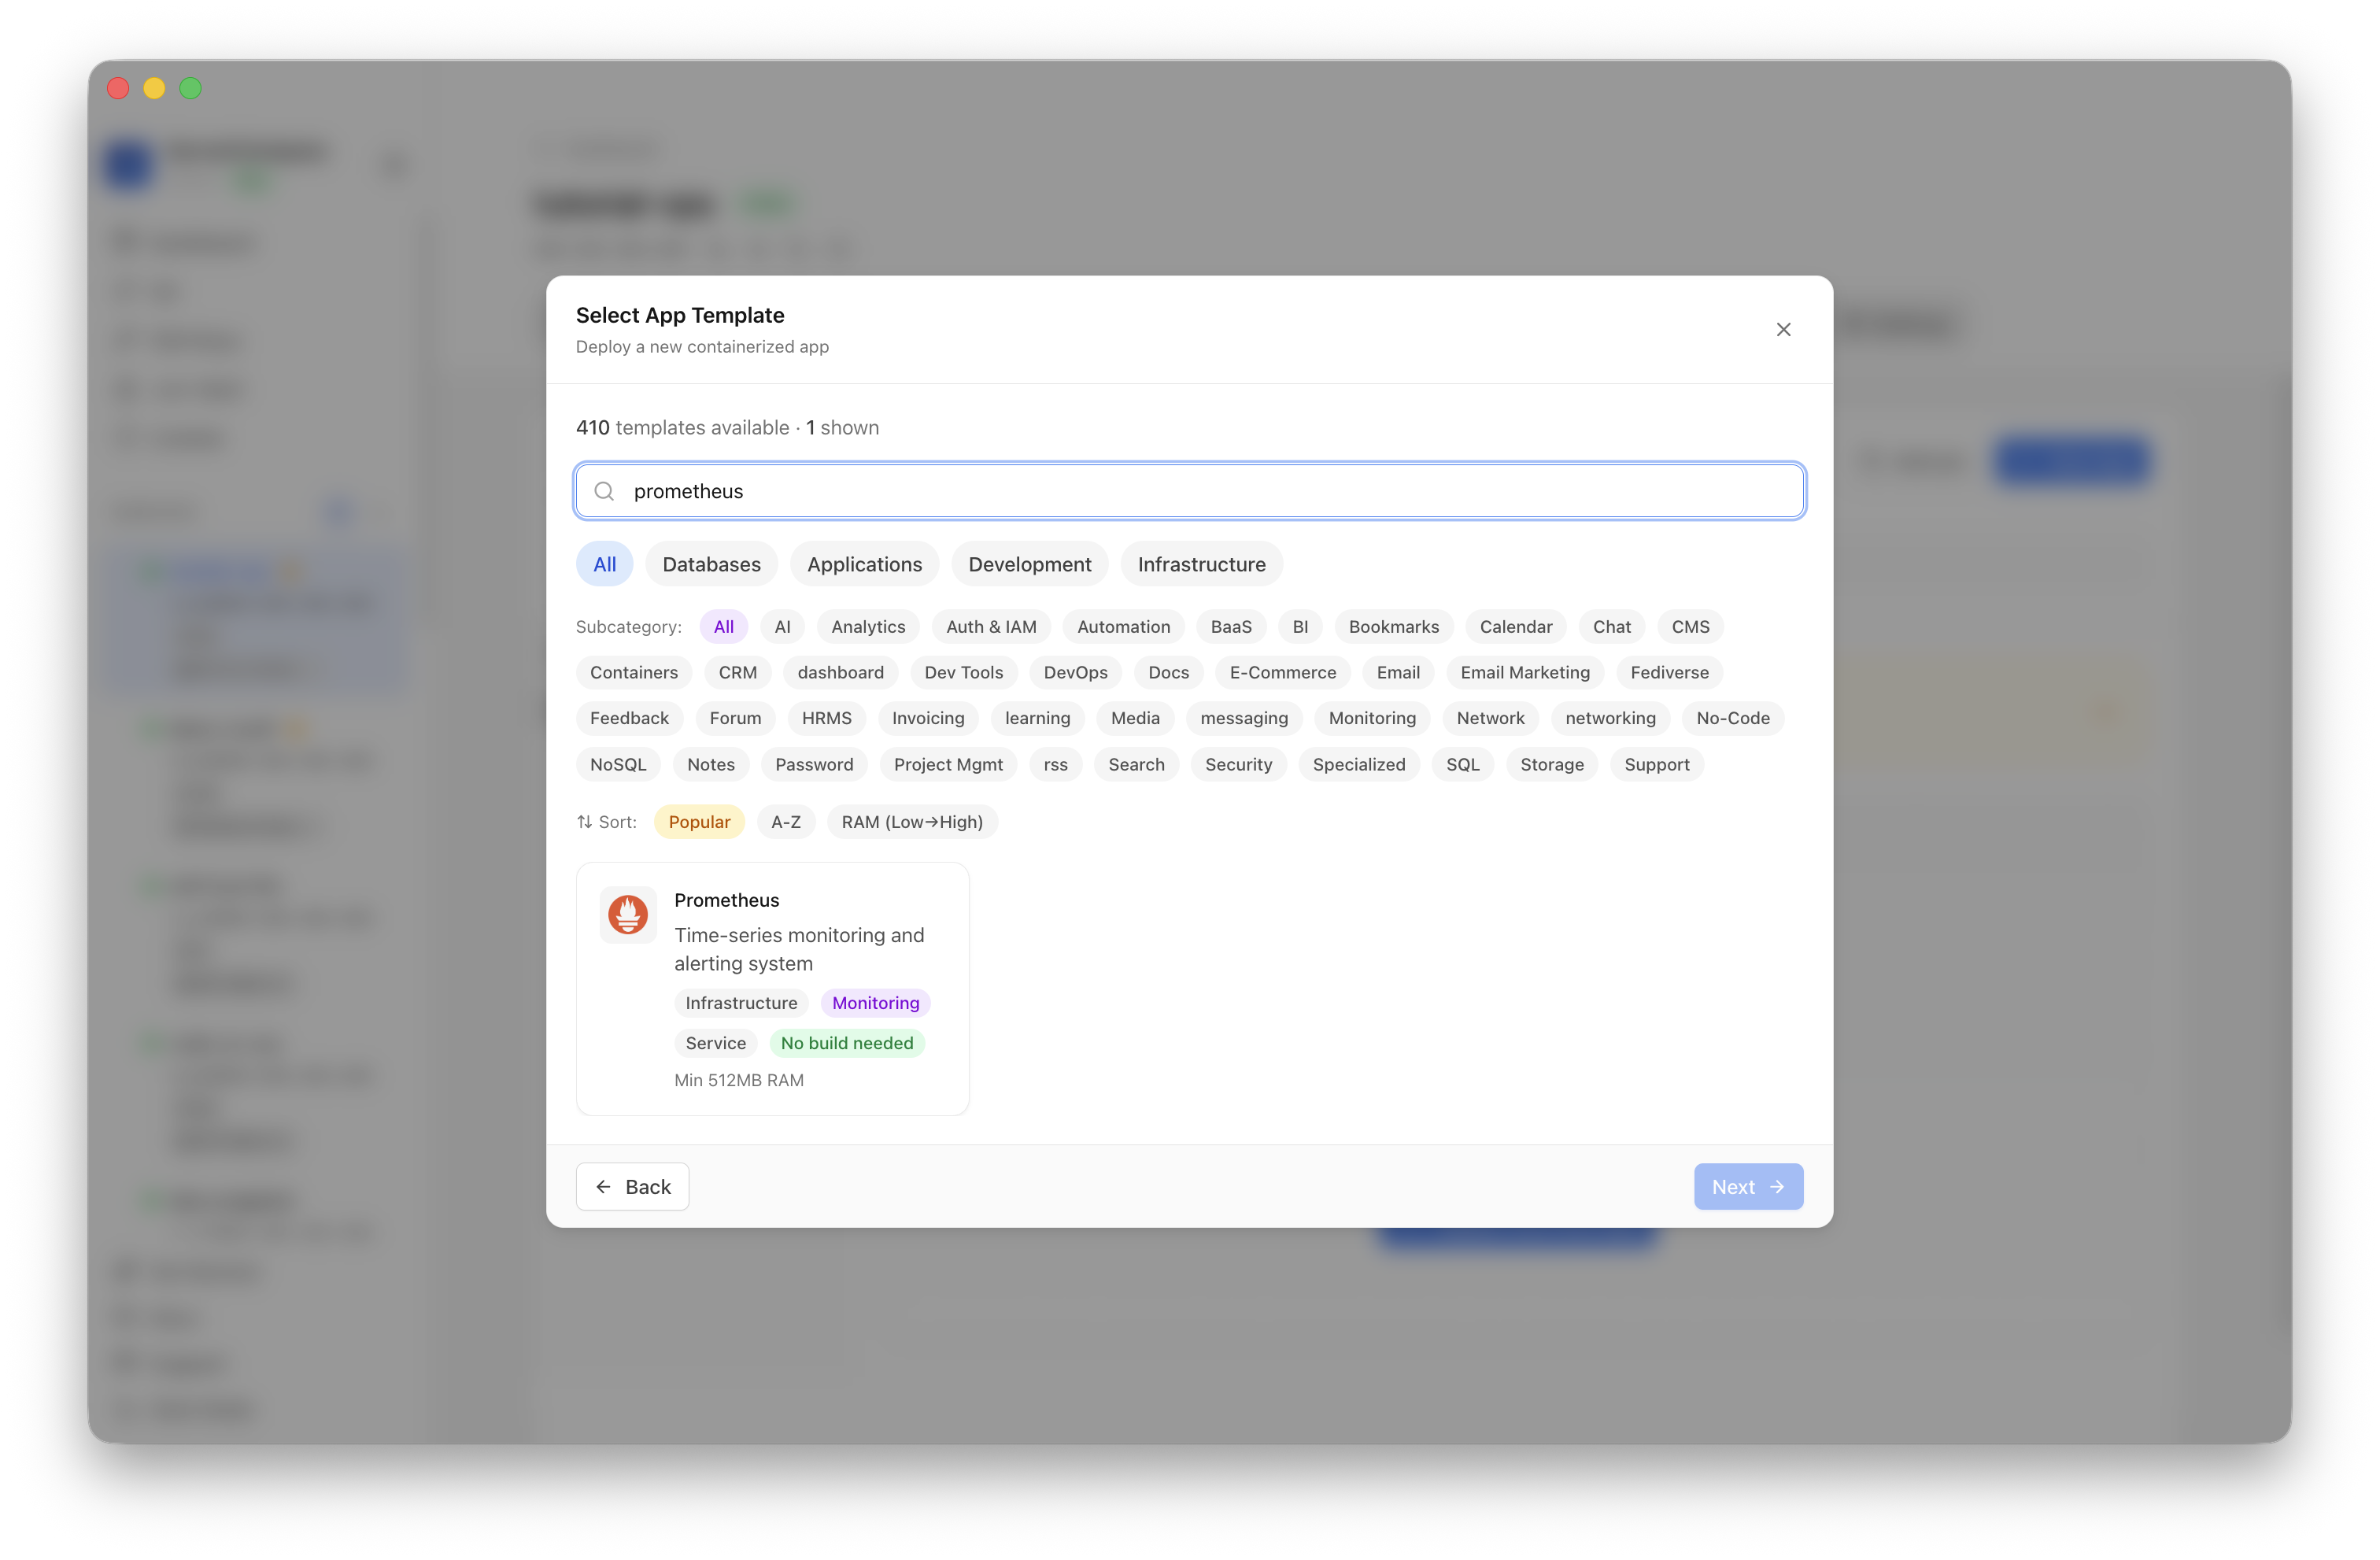
Choose the Prometheus template. Server Compass fills the official Prometheus image, persistent data volume, default command, and web port.
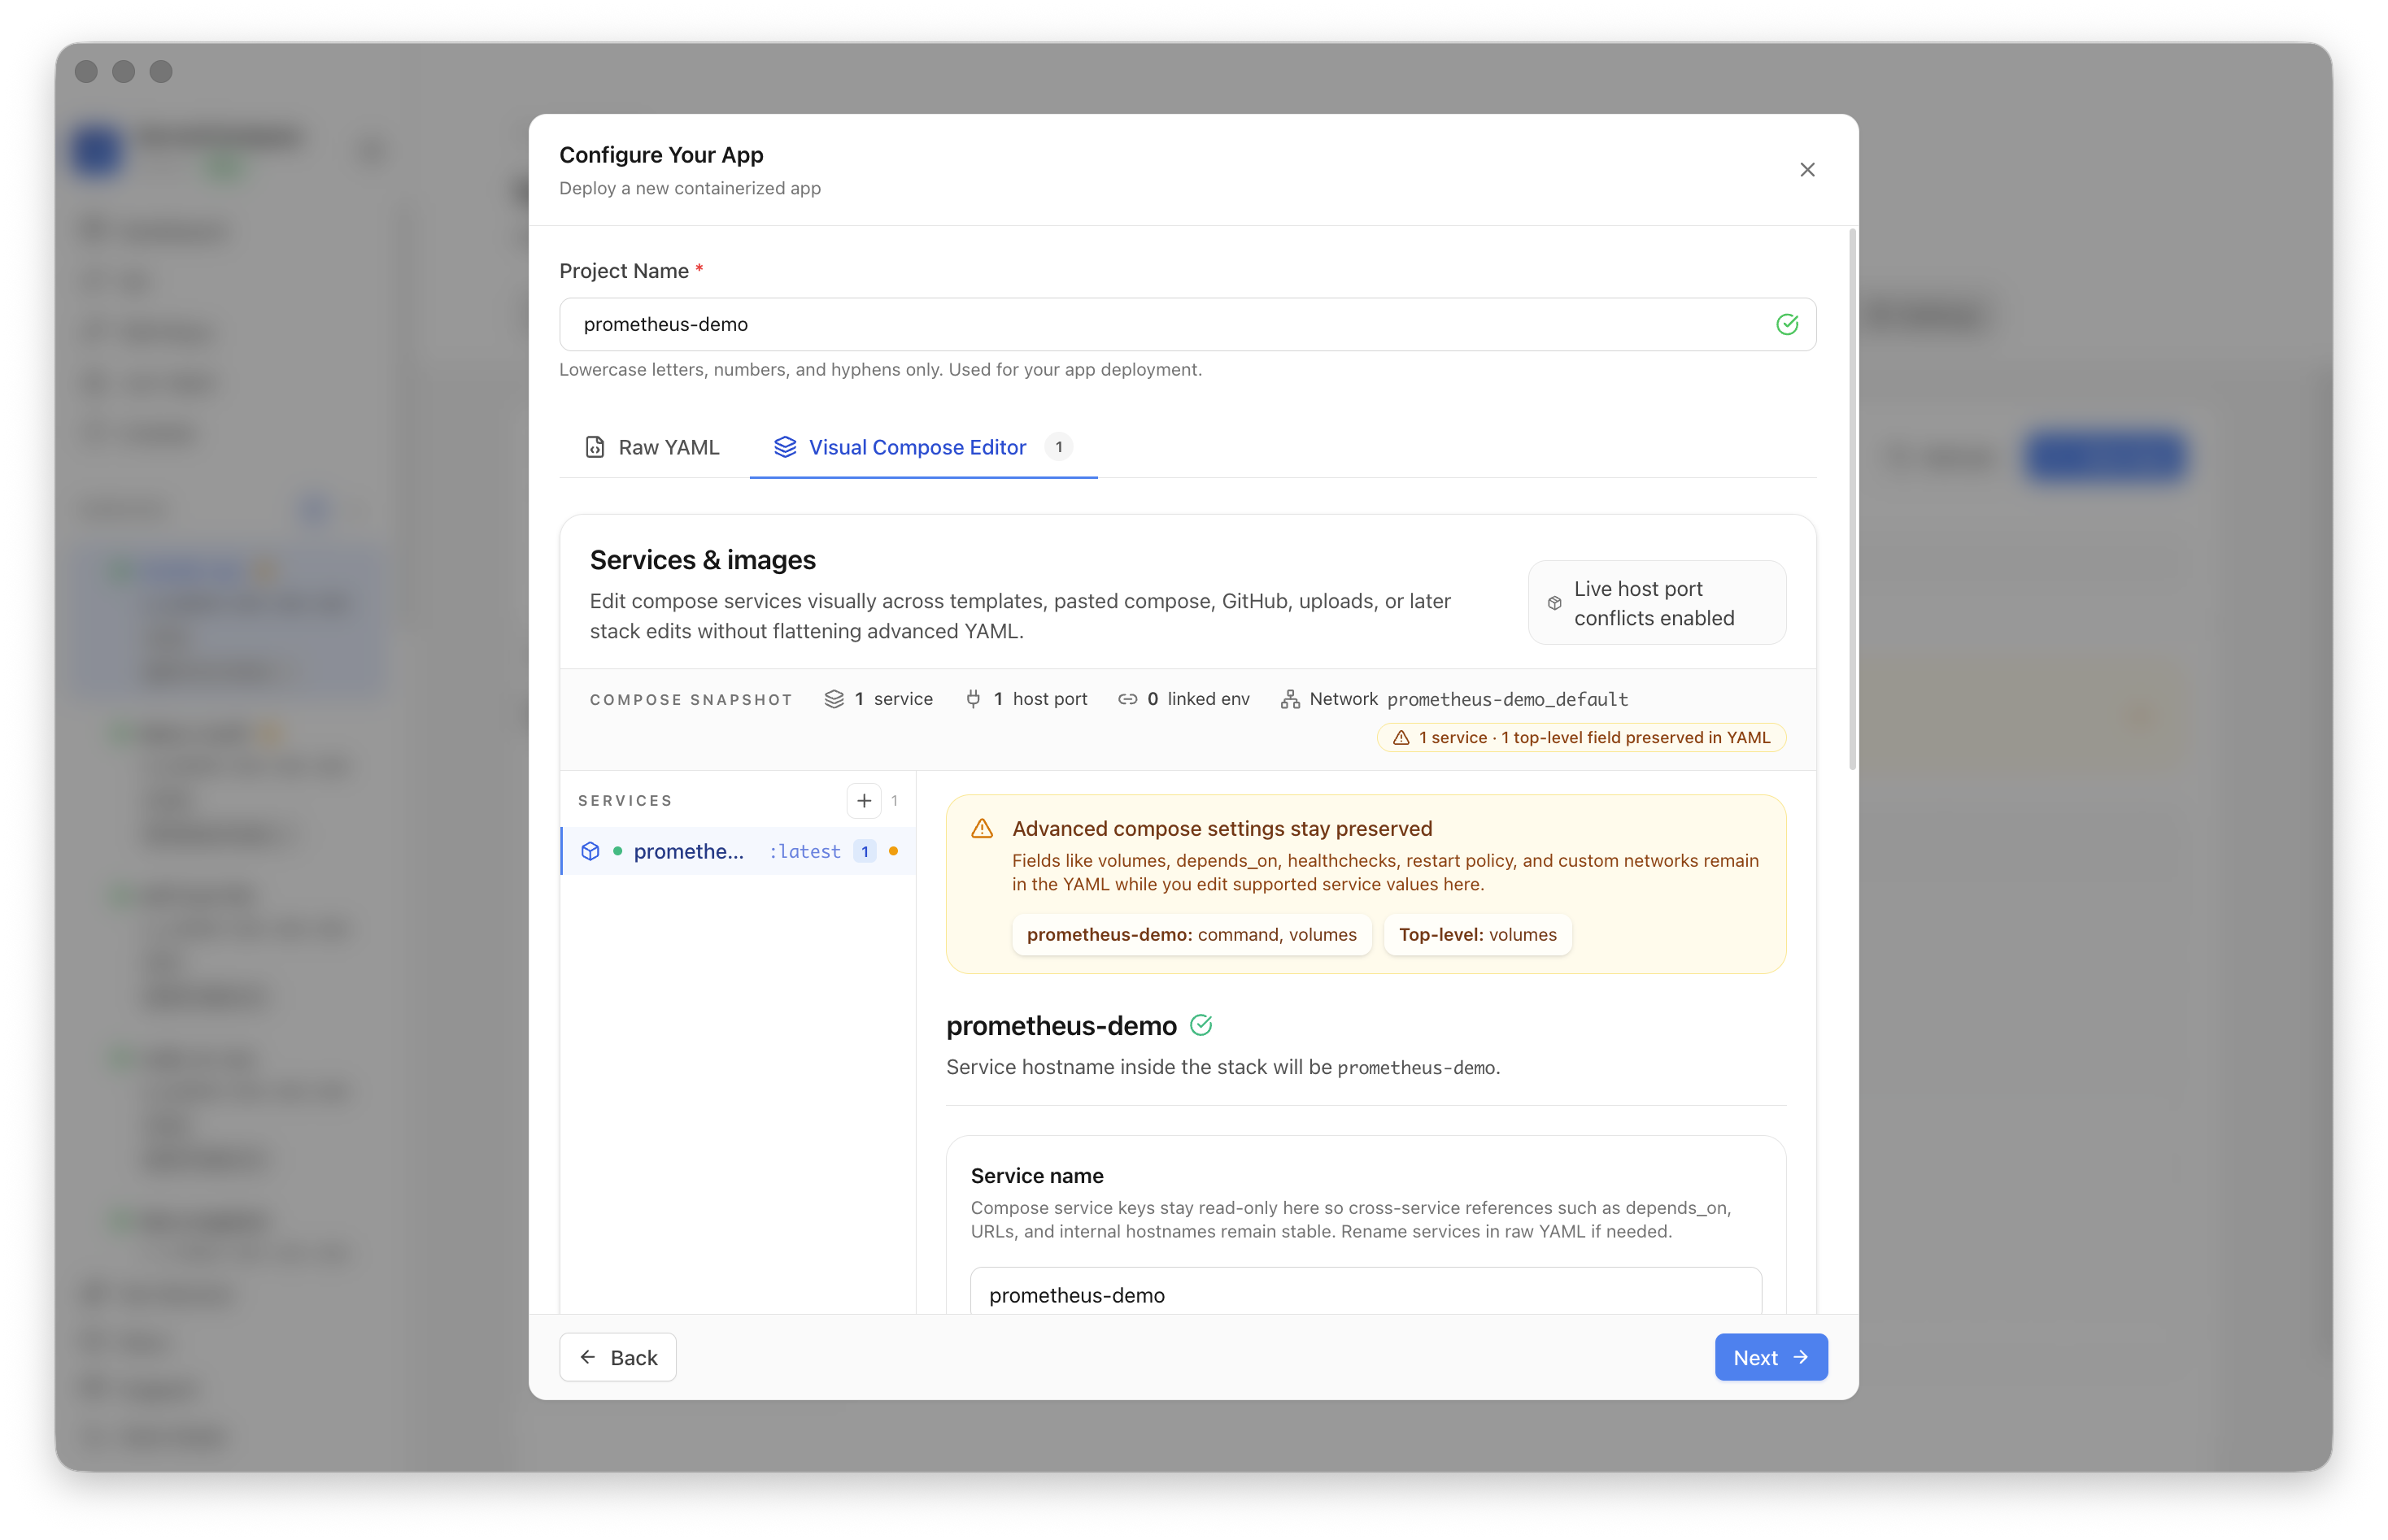
Confirm the app name, service image, preserved volume settings, and host port. In the pilot run, the app was named prometheus-demo and used host port 9090.
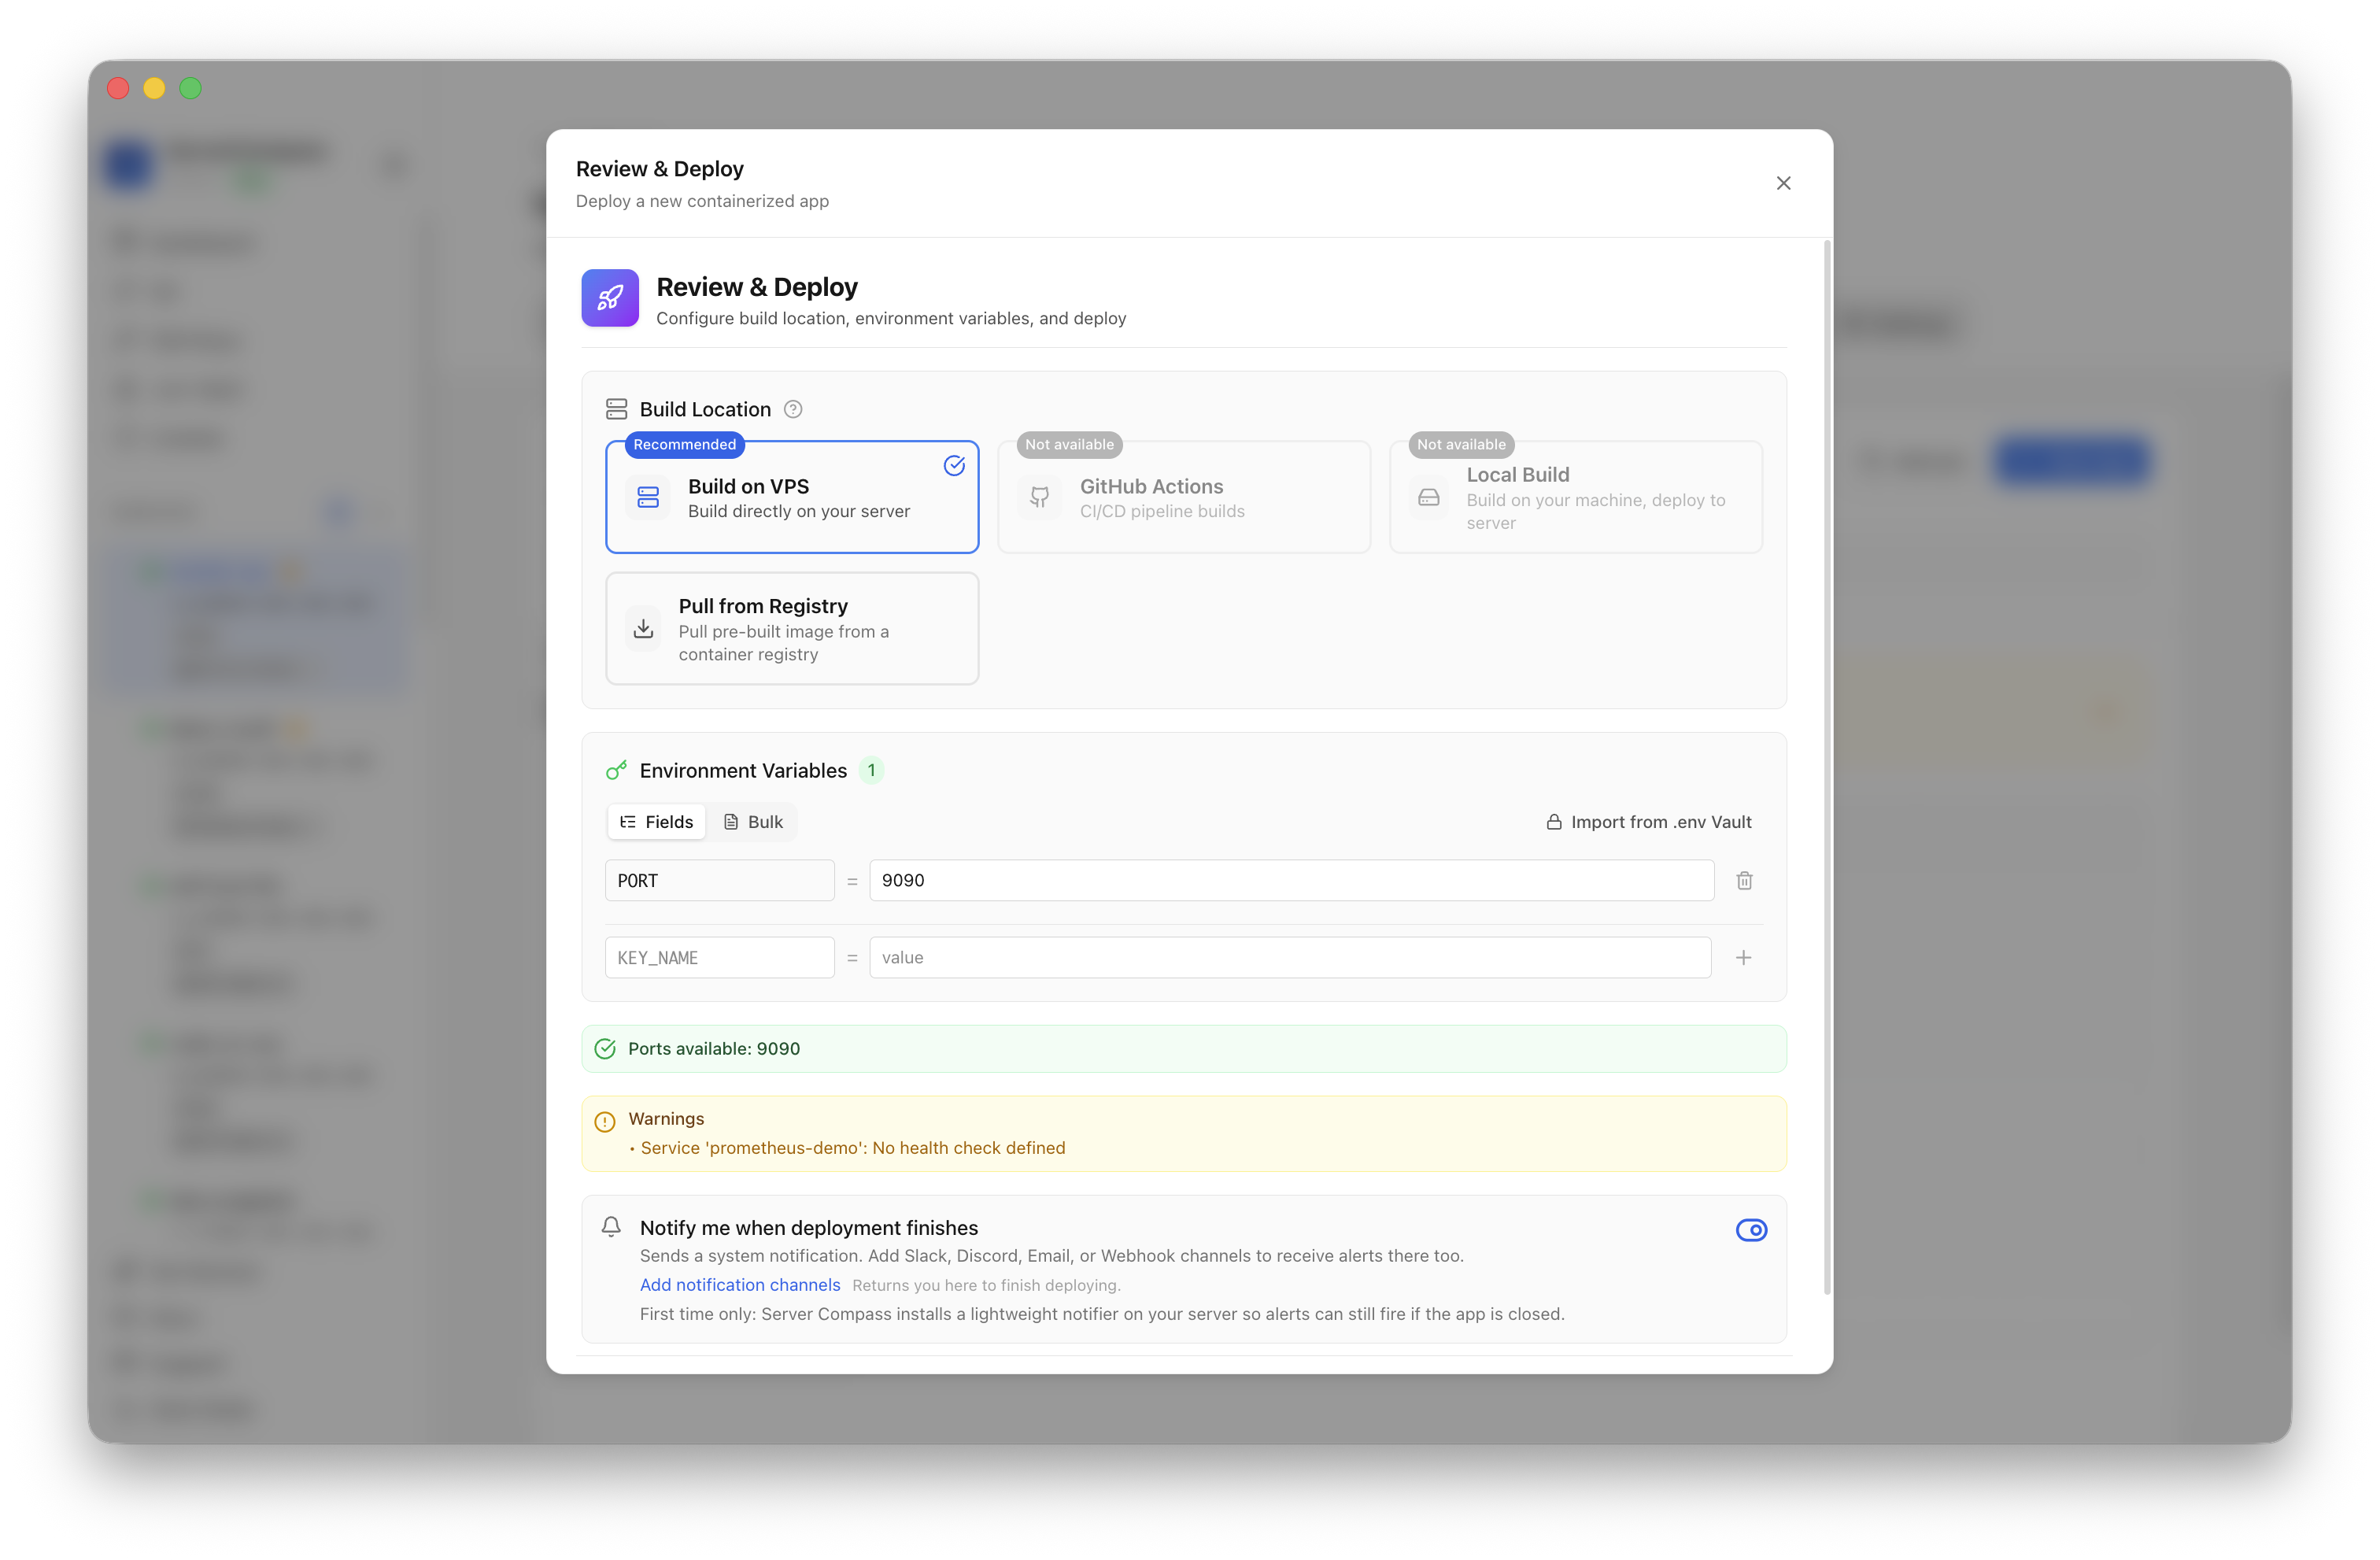
Review the Build on VPS option and the PORT value. When Server Compass confirms port 9090 is available, click Deploy Now.
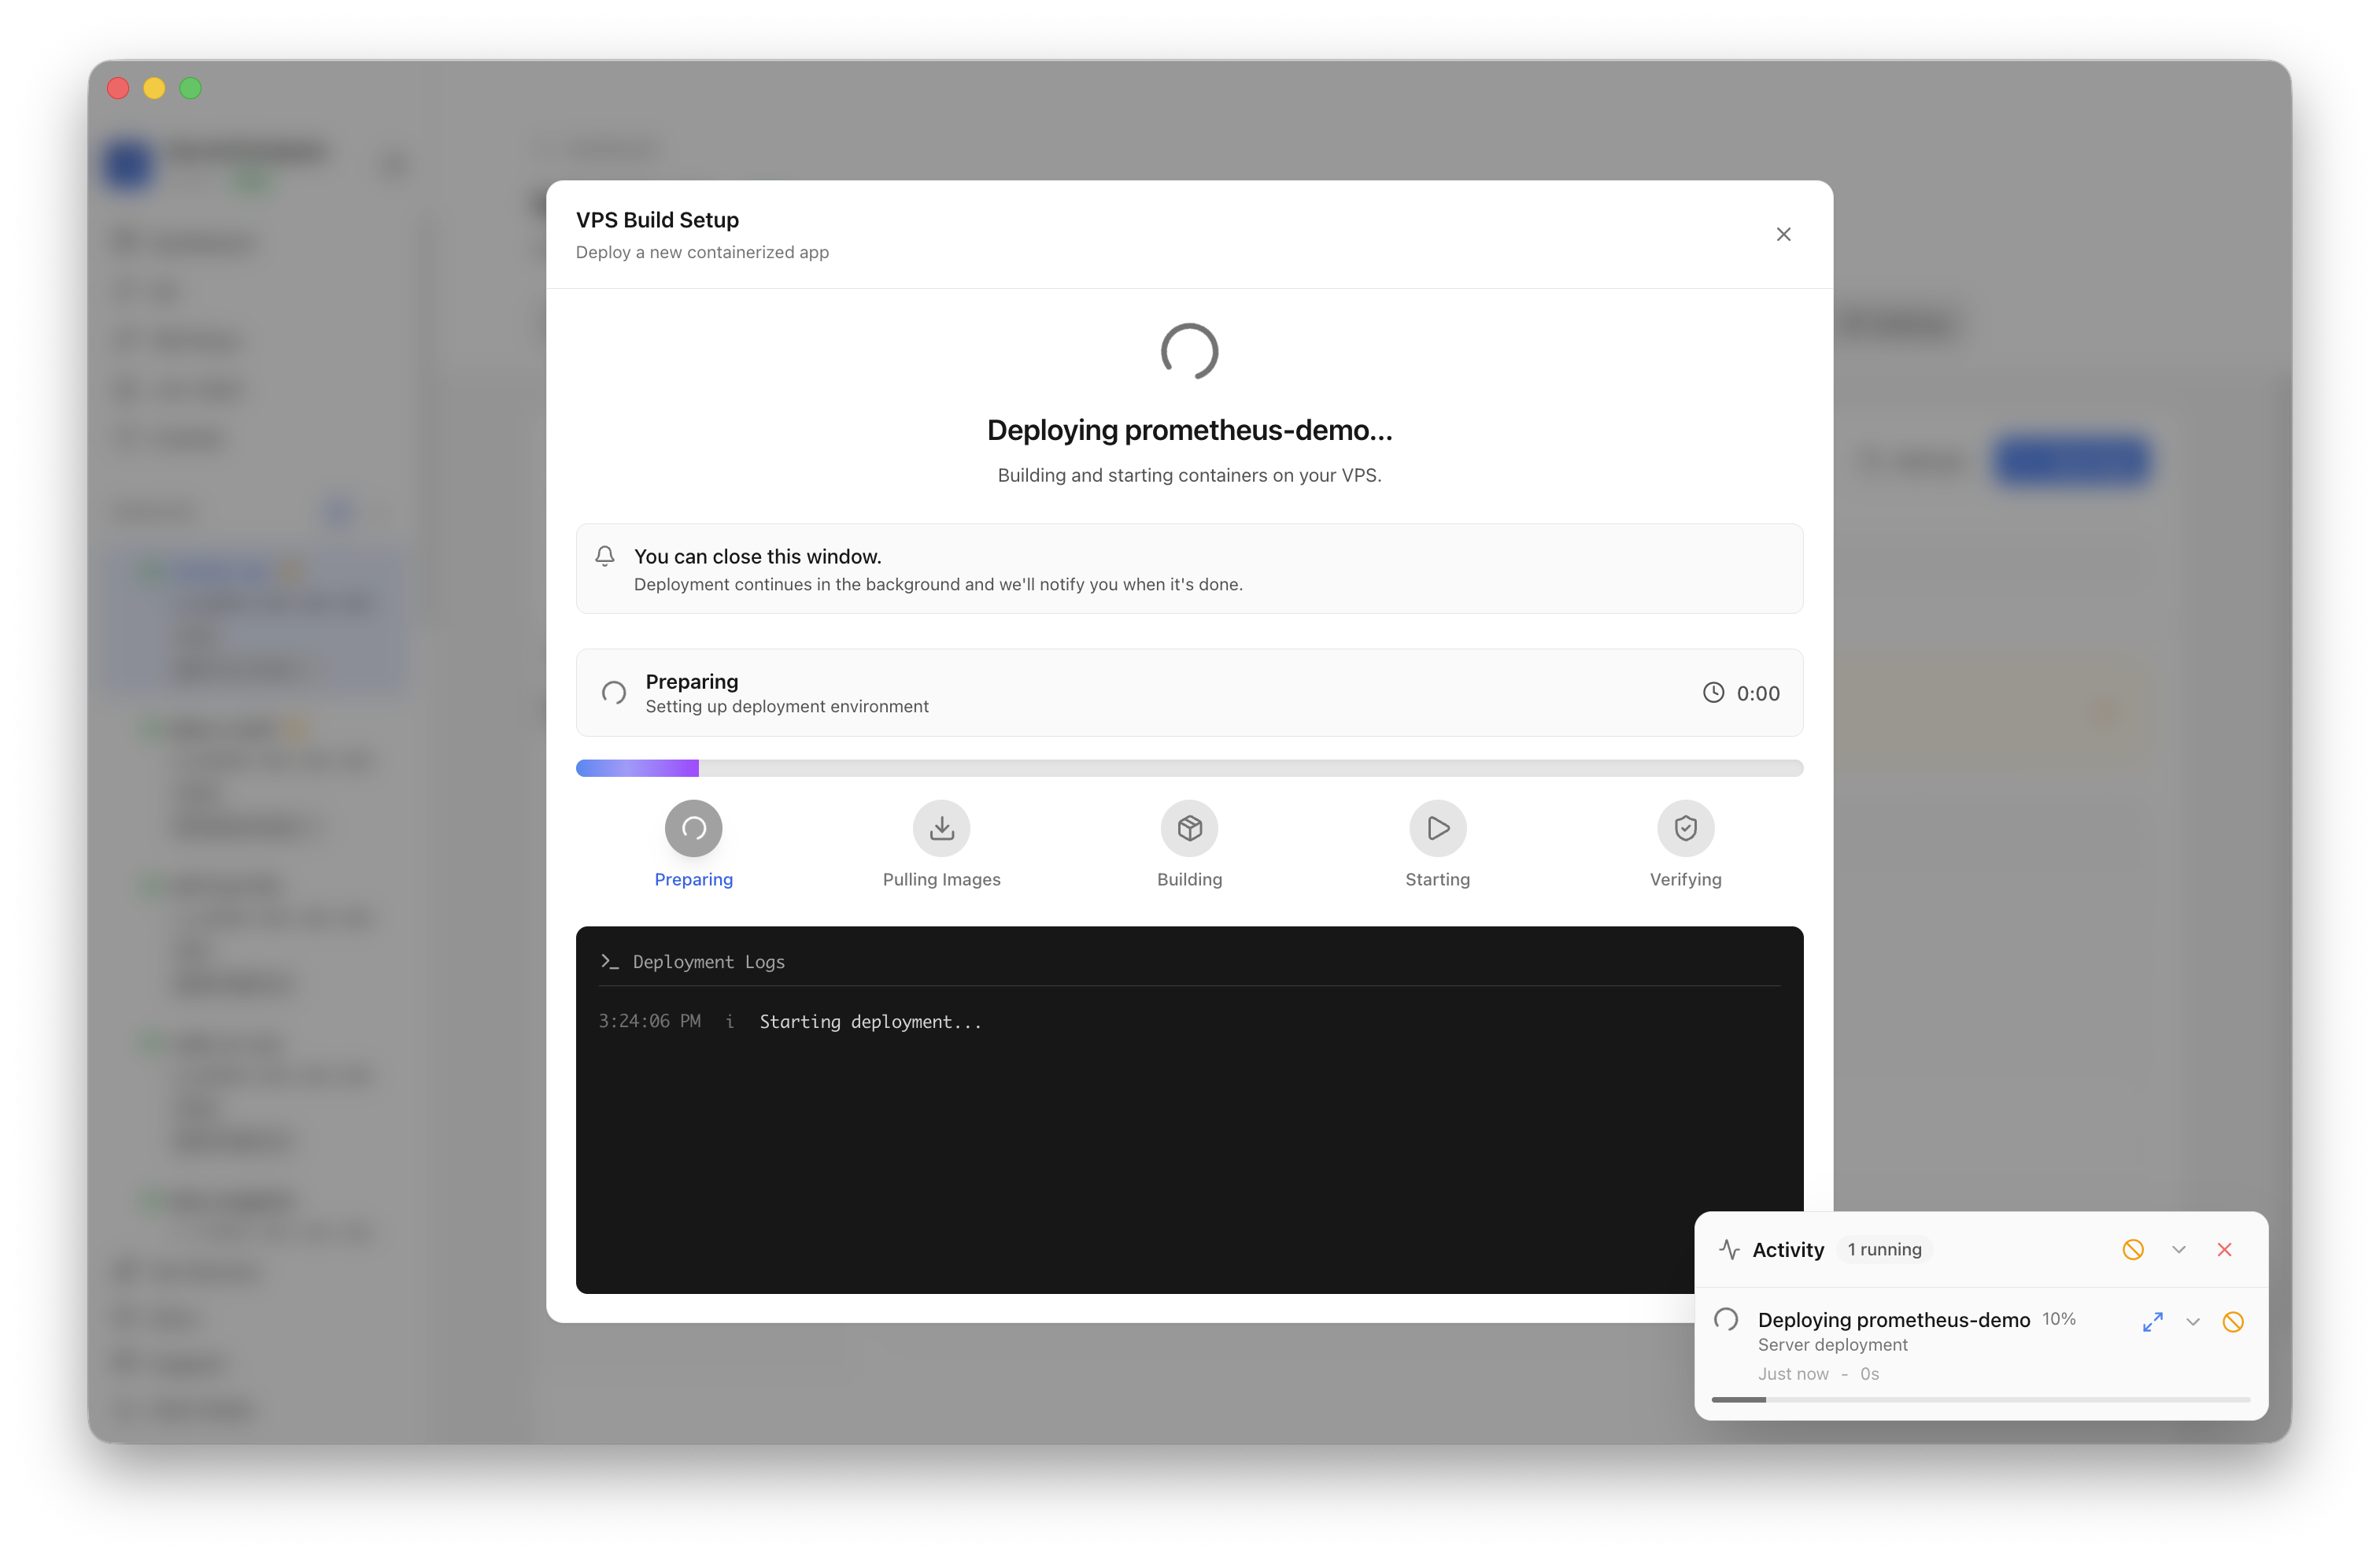
Keep the deployment modal open while Server Compass prepares the server, pulls the Prometheus image, starts the container, and verifies the service.
After deployment finishes, return to the Apps tab and confirm Prometheus is marked Running. The app card keeps the application URL available for browser access.
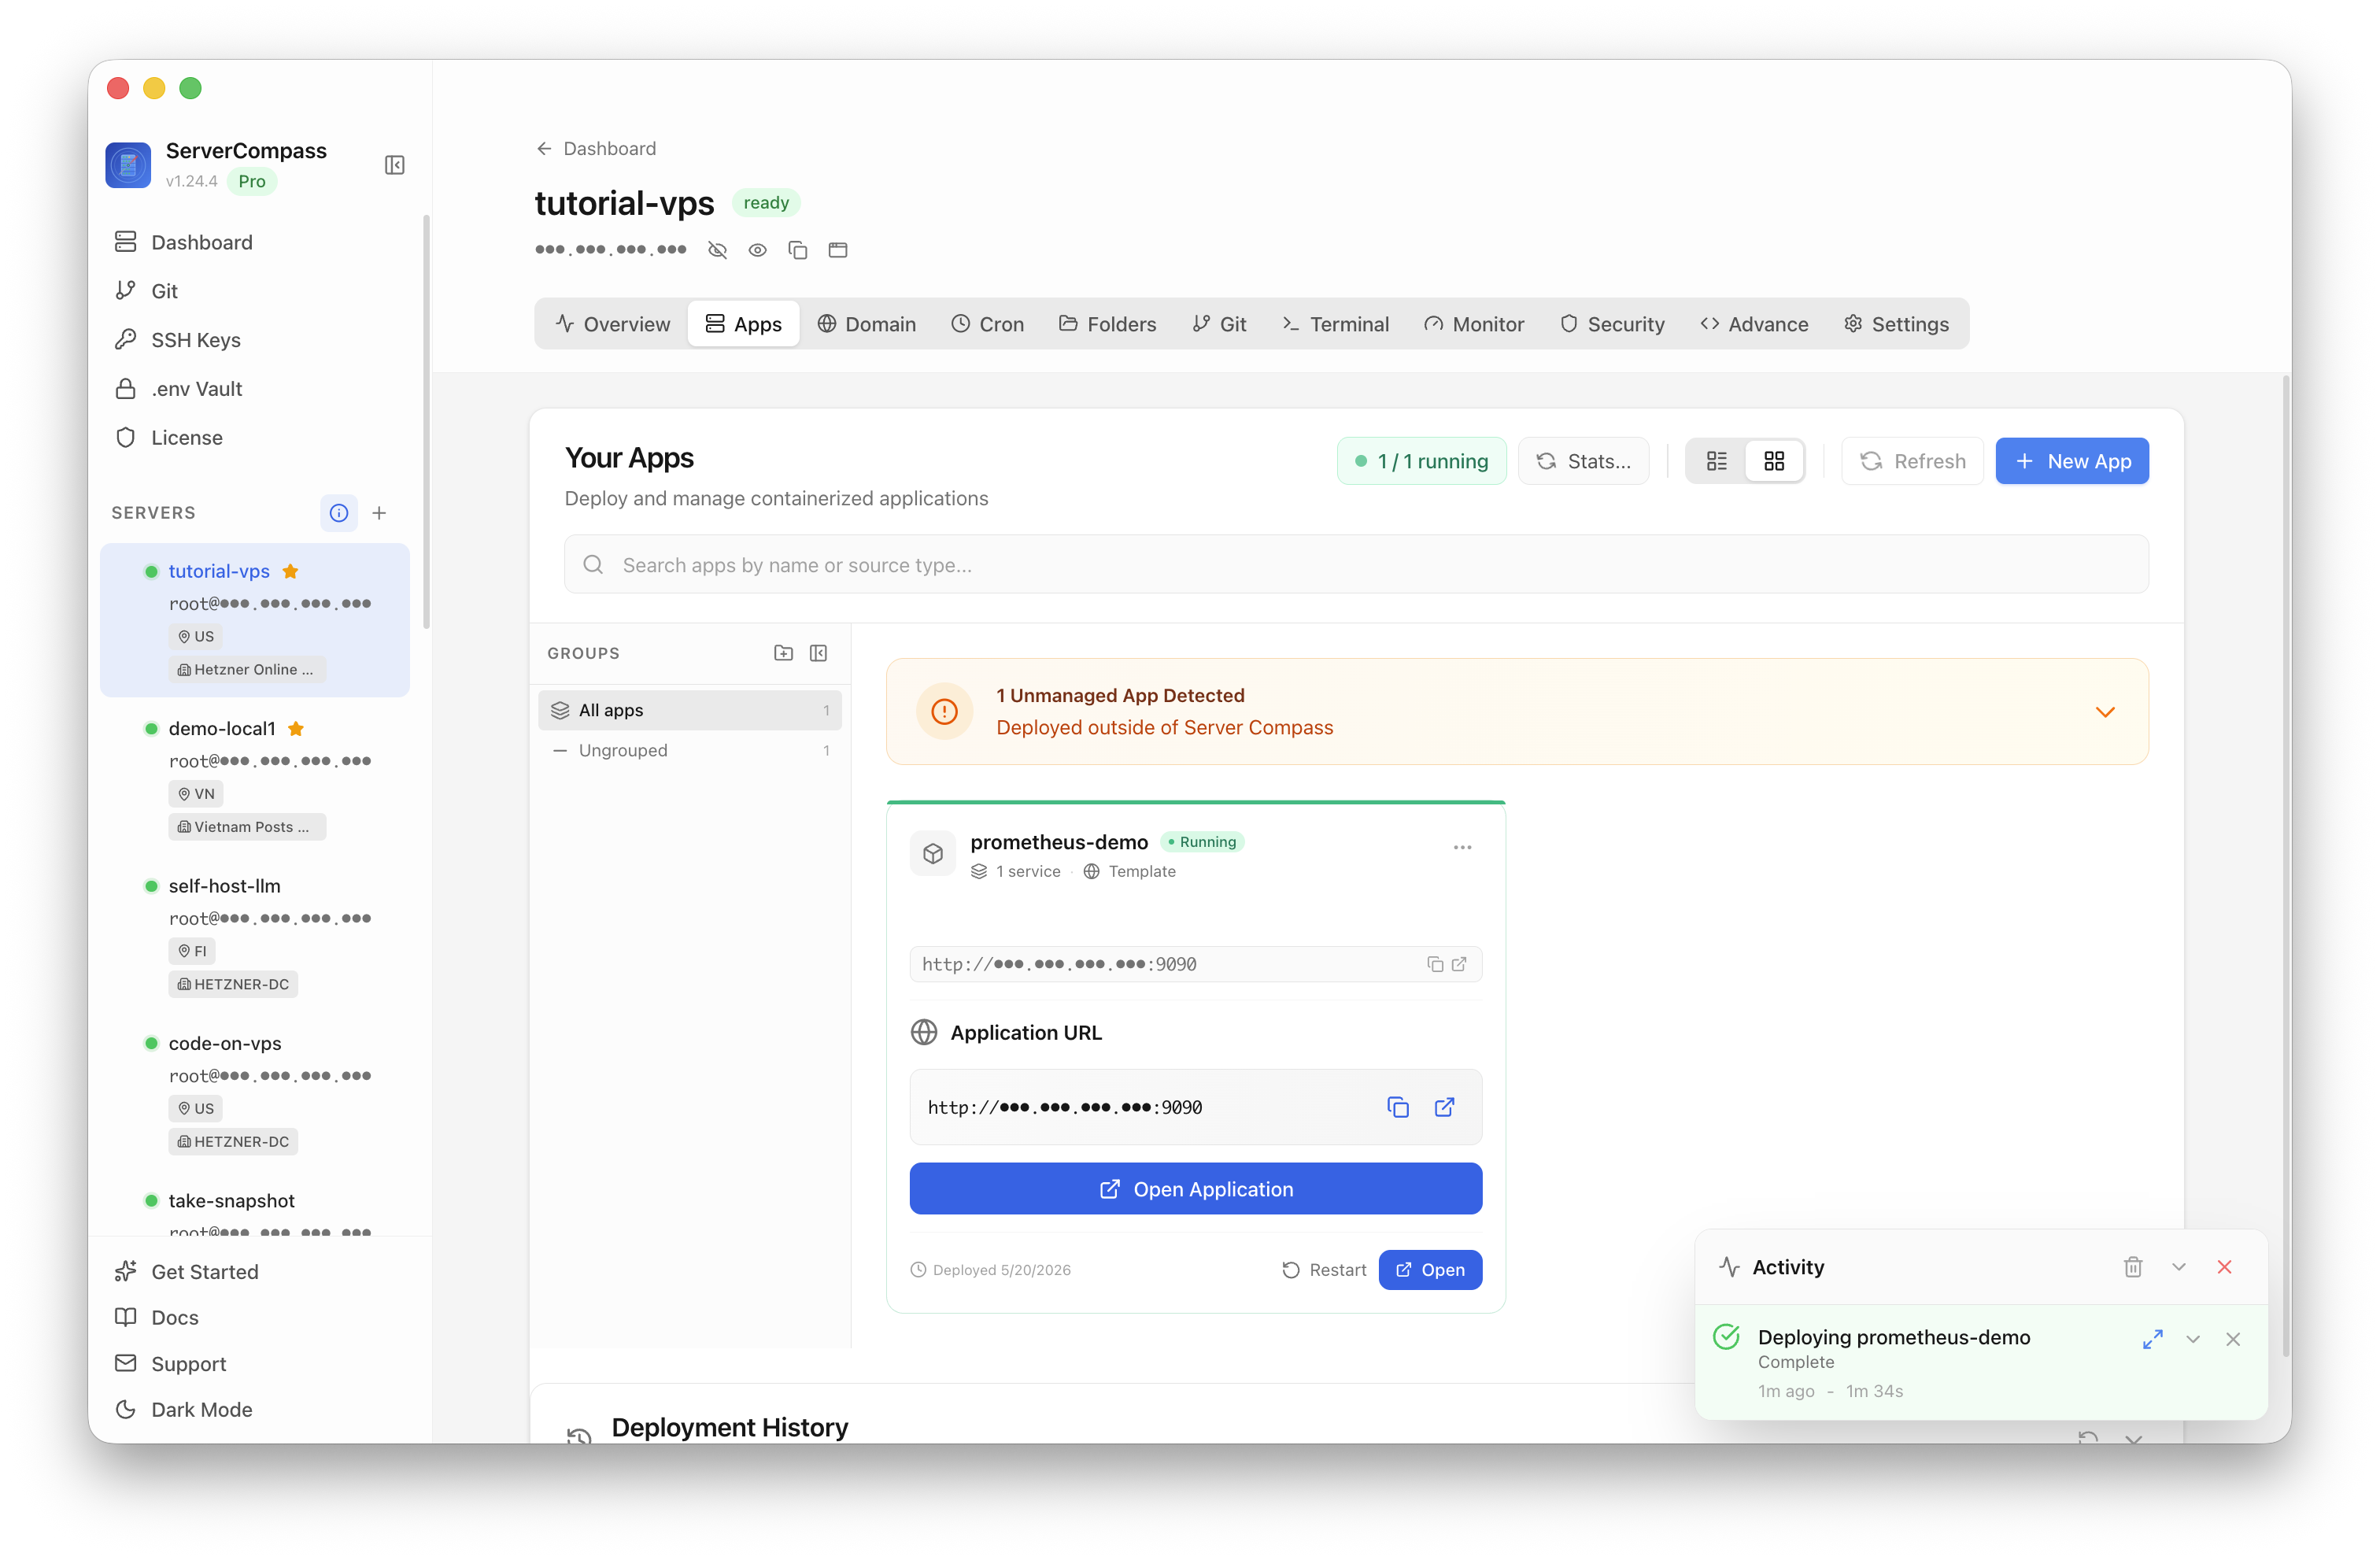
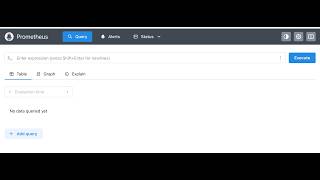
Click Open Application or open the application URL in a browser. The Prometheus query screen confirms the service is reachable and ready to collect or query metrics.
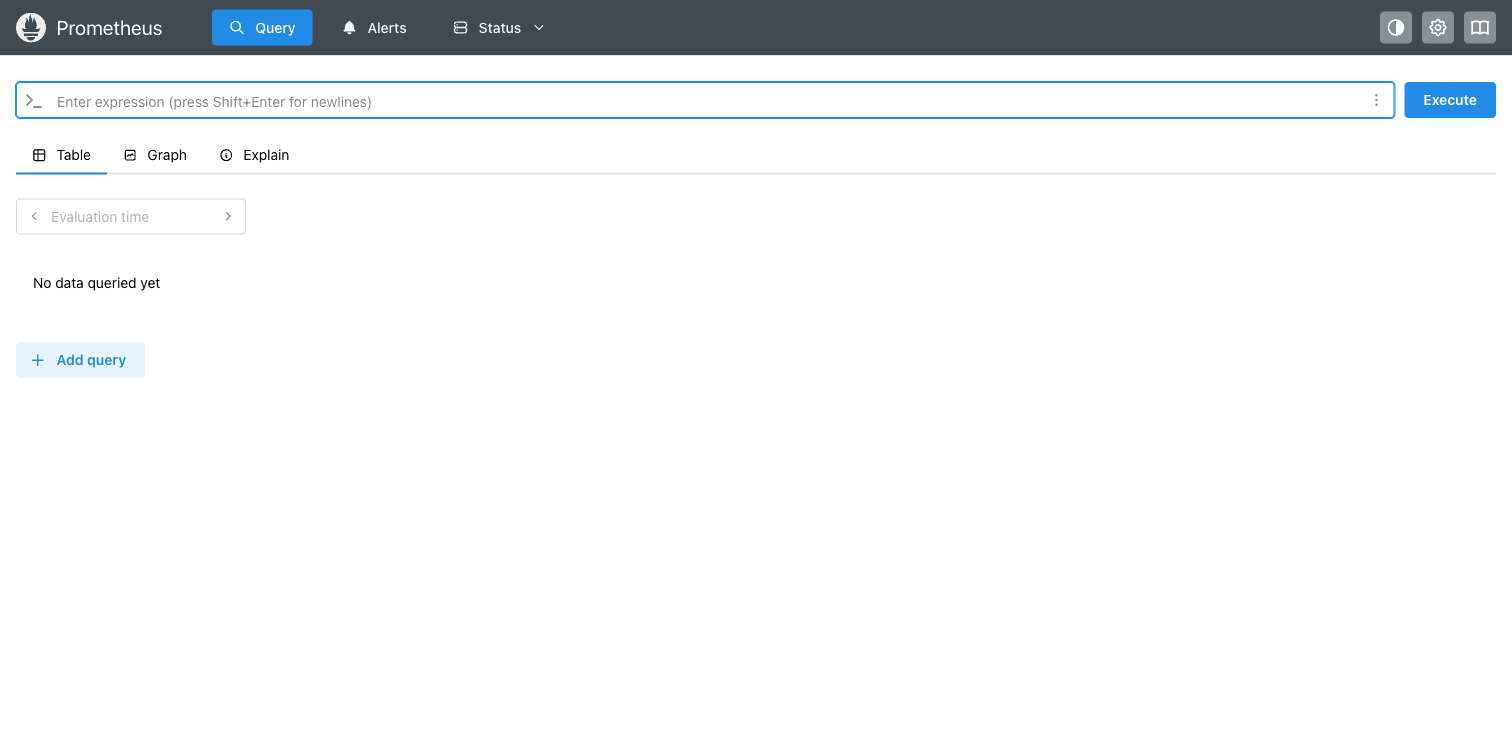
The browser loaded the Prometheus query UI successfully, and /-/ready returned 'Prometheus Server is Ready.'
It deploys the official Prometheus Docker image, a persistent data volume, the default Prometheus web UI, and the default web port.
The pilot used host port 9090, which maps to Prometheus's default container port.
Prometheus redirects the root URL to the query UI. Seeing that page confirms the container is running and reachable from a browser.
Usually no. For production, restrict access with firewall rules or put Prometheus behind a protected proxy with HTTPS and authentication.
No. The deployment guide should live on the Prometheus template detail page and be linked from the reusable template deployment docs page.
Learn how to self-host Prometheus with this hands-on deployment guide.
Open your terminal and connect to your server. Replace the IP address with your VPS IP.
# SSH into your server
ssh root@your-server-ip

# Using a custom SSH key
ssh -i ~/.ssh/id_rsa root@your-server-ip
First time? Need Docker? Install it: curl -fsSL https://get.docker.com | sh
Set up a clean directory for your application.
# Create and navigate to project directory
mkdir -p ~/apps/prometheus
cd ~/apps/prometheusSet up the container stack using this Docker Compose configuration:
services:
  prometheus:
    image: prom/prometheus:latest
    ports:
      - "9090:9090"
    command:
      - '--config.file=/etc/prometheus/prometheus.yml'
      - '--storage.tsdb.path=/prometheus'
      - '--web.enable-lifecycle'
    volumes:
      - prometheus_data:/prometheus
      - prometheus_config:/etc/prometheus
    restart: unless-stopped

volumes:
  prometheus_data:
  prometheus_config:
PORTHost port(default: 9090)Launch your application stack in the background.
# Start the containers in detached mode
docker compose up -d

# Check if containers are running
docker compose ps

# View logs
docker compose logs -fConfigure your firewall to permit external connections.
# Allow the application port through firewall
sudo ufw allow 9090/tcp
sudo ufw reload

# Access your app at:
# http://your-server-ip:9090Let Server Compass handle the complexity. Deploy Prometheus with a simple, intuitive interface.
After deploying Prometheus with Server Compass, complete these steps to finish setup
Create prometheus.yml configuration
Add scrape targets
Configure alerting rules
Need help? Check out our documentation for detailed guides.
Common questions about self-hosting Prometheus
Simply download Server Compass, connect to your VPS, and select Prometheus from the templates list. Fill in the required configuration and click Deploy. The entire process takes under 3 minutes.
Prometheus requires a minimum of 512MB RAM. We recommend a VPS with at least 1024MB RAM for optimal performance. Any modern Linux server with Docker support will work.
Yes! Server Compass provides volume mapping that allows you to import existing data. You can also use standard Prometheus backup and restore procedures.
Server Compass makes updates easy. Simply click the Update button in your deployment dashboard, and the latest Prometheus image will be pulled and deployed with zero downtime.
Prometheus is open-source software. You only pay for your VPS hosting (typically $5-20/month) and optionally Server Compass ($29 one-time). No subscription fees or per-seat pricing.
Download Server Compass and deploy Prometheus to your VPS in under 3 minutes. No Docker expertise required.
Download Server Compass