Per-App Metrics Dashboard
Every Docker app gets a Metrics tab: response times by p50/p95/p99, requests stacked by status code, CPU/memory/network over time, and a top-slow-paths panel for HTTP apps routed through Traefik. Plus a one-click container shell that opens straight into the running container, a system tray with live deployment status, and a sidebar update pill that surfaces new versions immediately.
Download v1.24.0
Get this version from GitHub Releases
What's Changed
New Features
8- New Metrics tab on every Docker app — See response times, request volume by status code, network in/out, and CPU/memory over time without leaving Server Compass. Time range picker for the last 1 hour, 6 hours, 12 hours, 24 hours, or 7 days. p50, p95, and p99 response time percentiles for apps routed through Traefik. Stacked request charts split by 2xx, 3xx, 4xx, and 5xx status codes. Universal CPU, memory, and network panels for every running container. Top slow paths panel for HTTP apps so you can spot which routes are dragging.
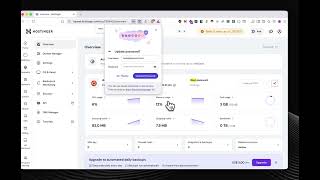
- Turn metrics collection on or off per server — A clear switch in the Metrics tab enables or disables collection, with its own confirmation.
- See exactly how much storage metrics use — Storage rows show how much disk metrics take up locally on your machine and on the VPS.
- Clear note for direct IP/port apps — Apps without a domain get the universal panels and a label explaining HTTP request metrics need a Traefik domain.
- Lazy-loaded Metrics tab — The tab only fetches data when you open it, so app pages stay fast for everything else.
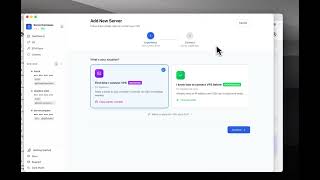
- Container Shell — A Shell button on the App detail opens a separate terminal window already inside the container — no more SSH'ing to the server and typing
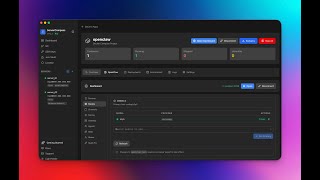
docker exec. Bash is used when available, with a graceful fallback toshfor minimal images. The terminal title shows the container name so you always know where you are. If the container has no shell, the terminal explains what to do instead of failing silently. - System Tray — New menu bar / system tray icon for quick access to servers, active deployments, and a one-click Show Window without bringing the dock app forward. The tray menu lists deployments that are currently pulling, building, or starting so you can keep an eye on them in the background. Favorite servers appear at the top of the tray menu.
Update vX.Y.Zbutton in the sidebar — When a new version is ready, a button appears in the sidebar so you never miss an update.
Improvements
4- Static Site Uploads — Build outputs are no longer skipped —
dist,build, andoutfolders are uploaded by default, so static sites work the first time without manual ignore tweaks. - Dockerfile and compose files stay out of the image — Generated images no longer ship with
Dockerfileordocker-compose.ymlinside/app, fixing a small but real security issue. - Domain Configurations now reads label-only Traefik stacks correctly — If your compose files don't publish ports and route everything through Traefik labels (
traefik.enable=true+ shared external network), the Domain tab now shows the correct stack and container port instead of a wrong guess. Domain-to-stack matches are persisted, so refreshes and recheck no longer flip back toNeeds review. Each domain shows the exact labels you need (traefik.enable=true, network, router host, entrypoint, certresolver, loadbalancer port) for label-only setups. - SSL Certificate Status Sync — A real Let's Encrypt cert now reflects on both screens at once instead of one saying
Activeand the other sayingNo SSL. Recheck a certificate and the domain row updates immediately with the new state.
Bug Fixes
5- Fixed
dist,build, andoutfolders being silently skipped on upload — Static site deploys no longer ship empty containers because the actual build output got excluded. - Fixed generated Dockerfile/compose files being copied into runtime images — Server Compass-generated
Dockerfileanddocker-compose.ymlare now excluded from the built image. - Fixed Domain Configurations showing wrong ports and stacks for label-only Traefik setups — Stacks that only expose services through Traefik labels are now mapped correctly.
- Fixed stale
No SSLstate after a certificate became active — The Domain Configurations list now refreshes when SSL Certificates confirms a working cert. - Fixed container shells failing silently on minimal images — The terminal now falls back to
shand explains the situation instead of dying without output.
Screenshots
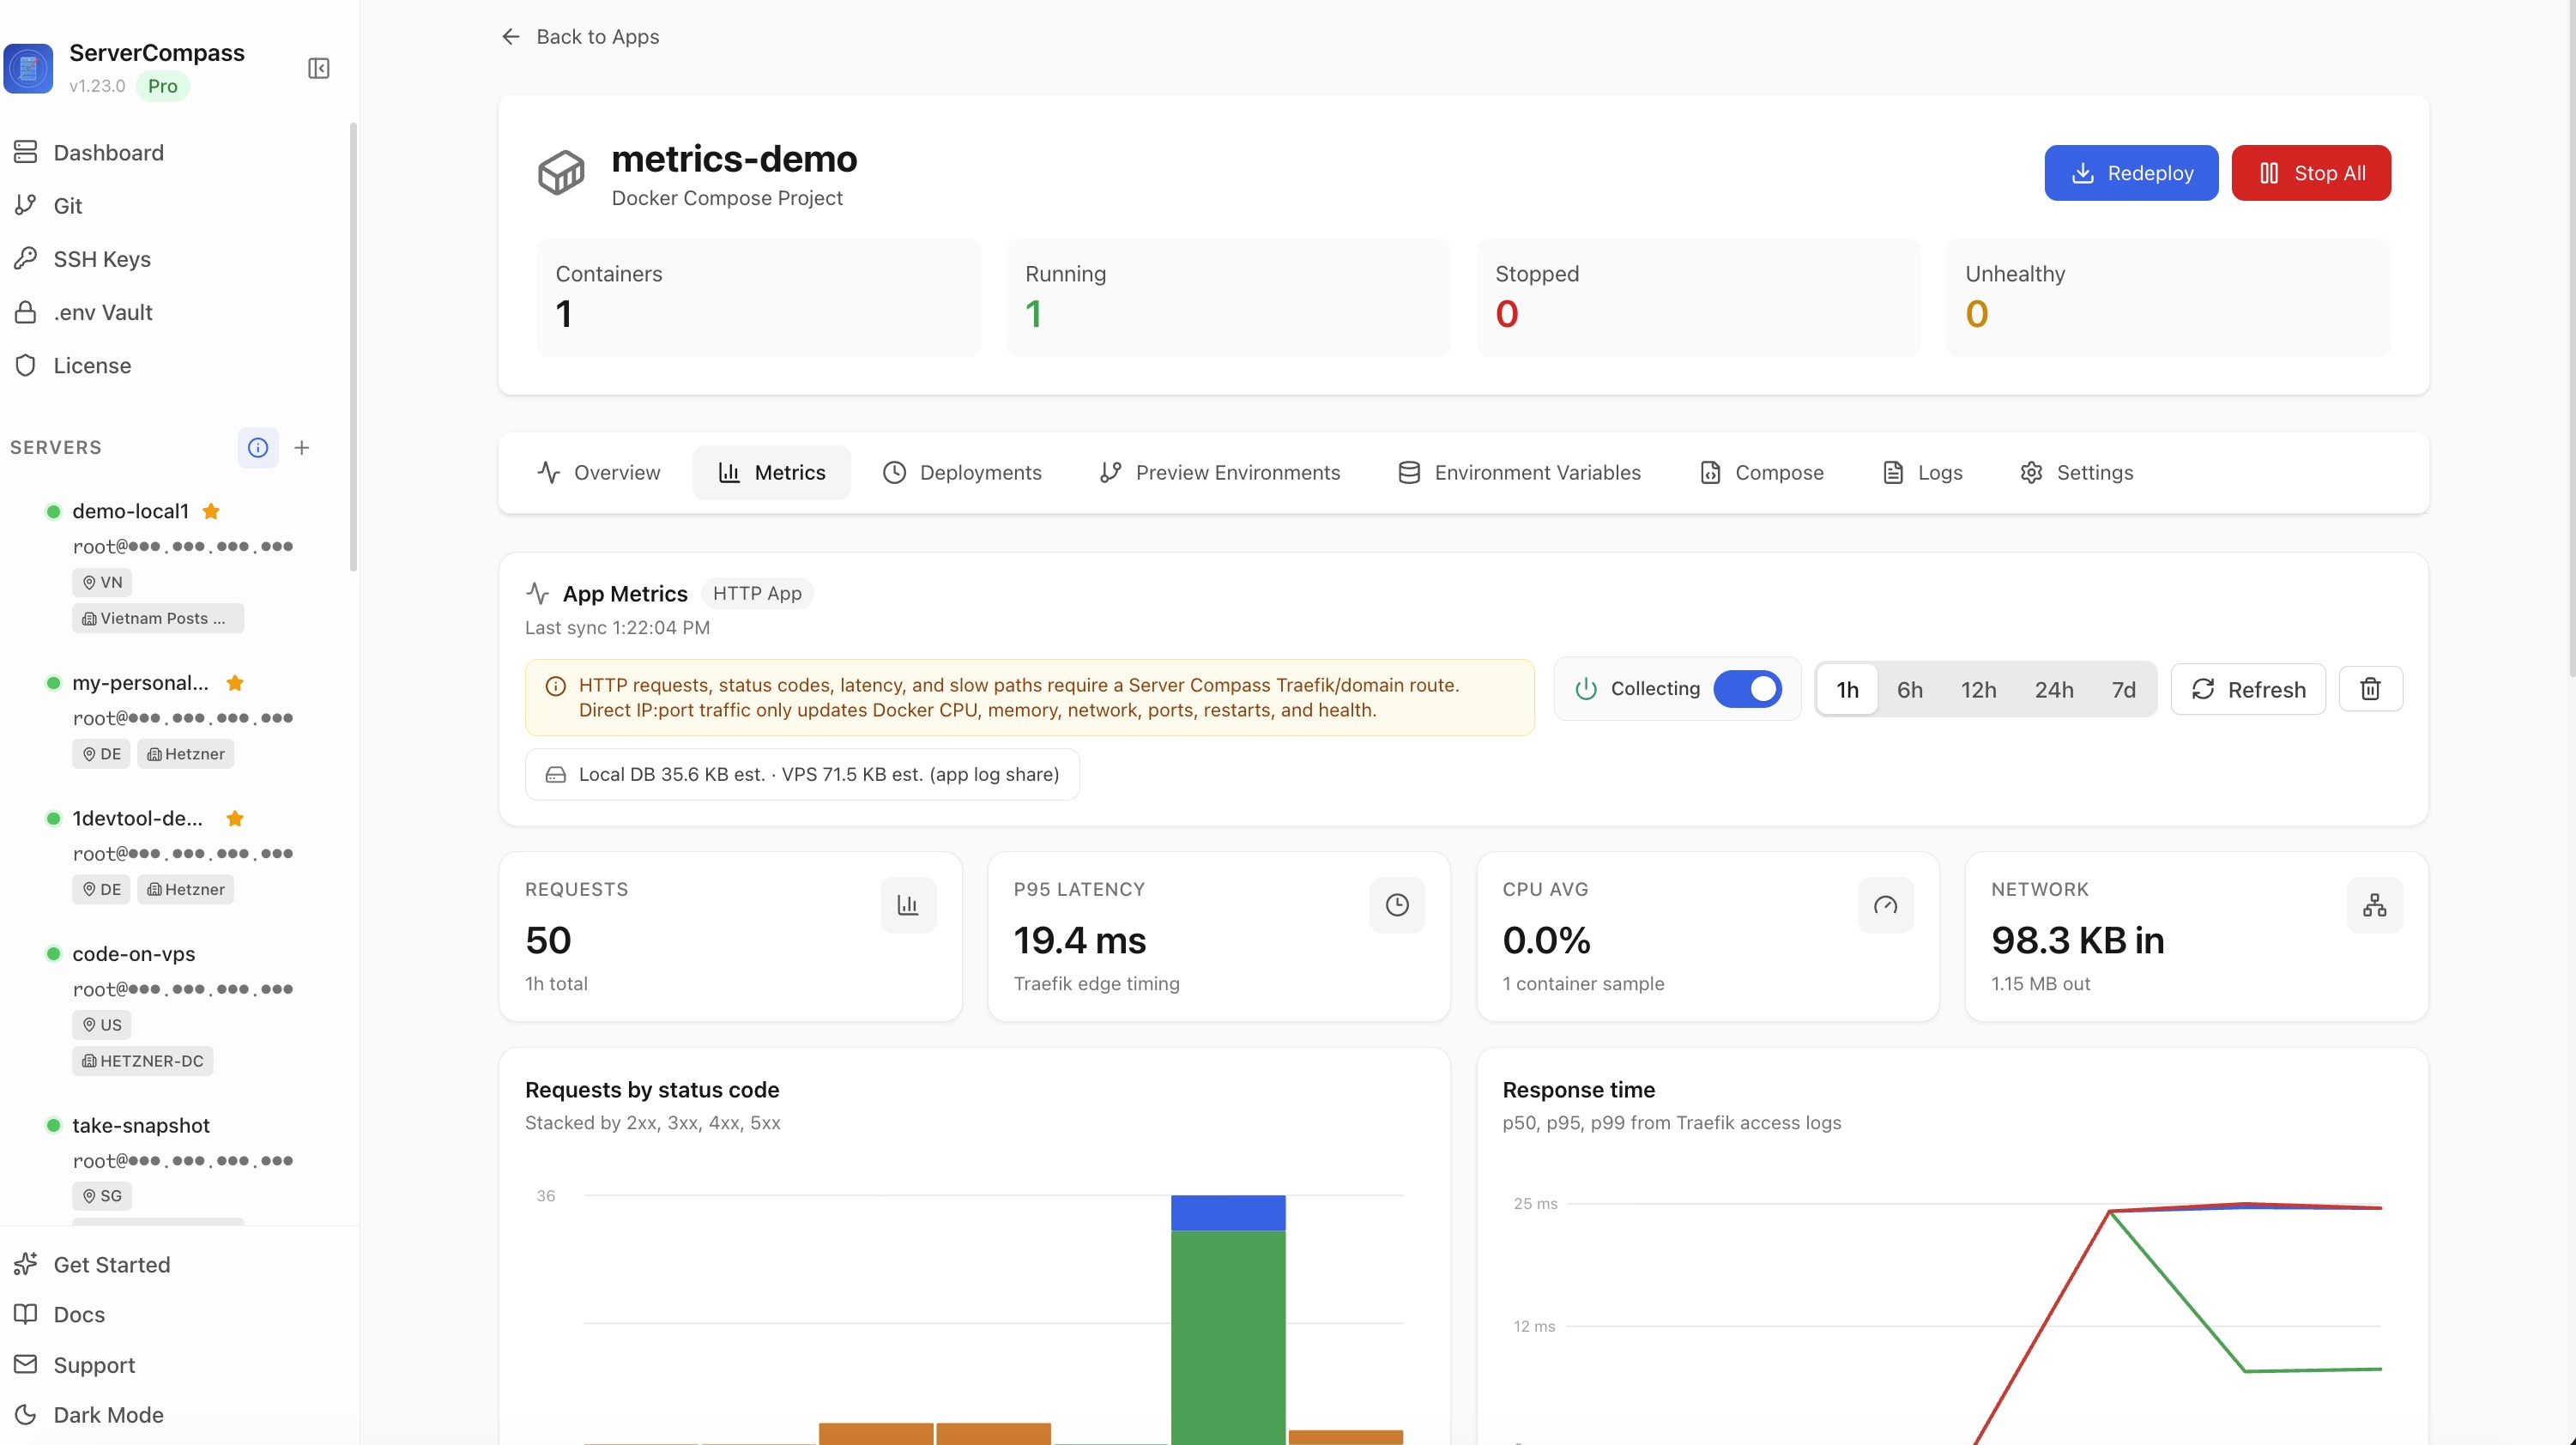
Per-App Metrics Dashboard with request volume, p95 latency, CPU and network charts
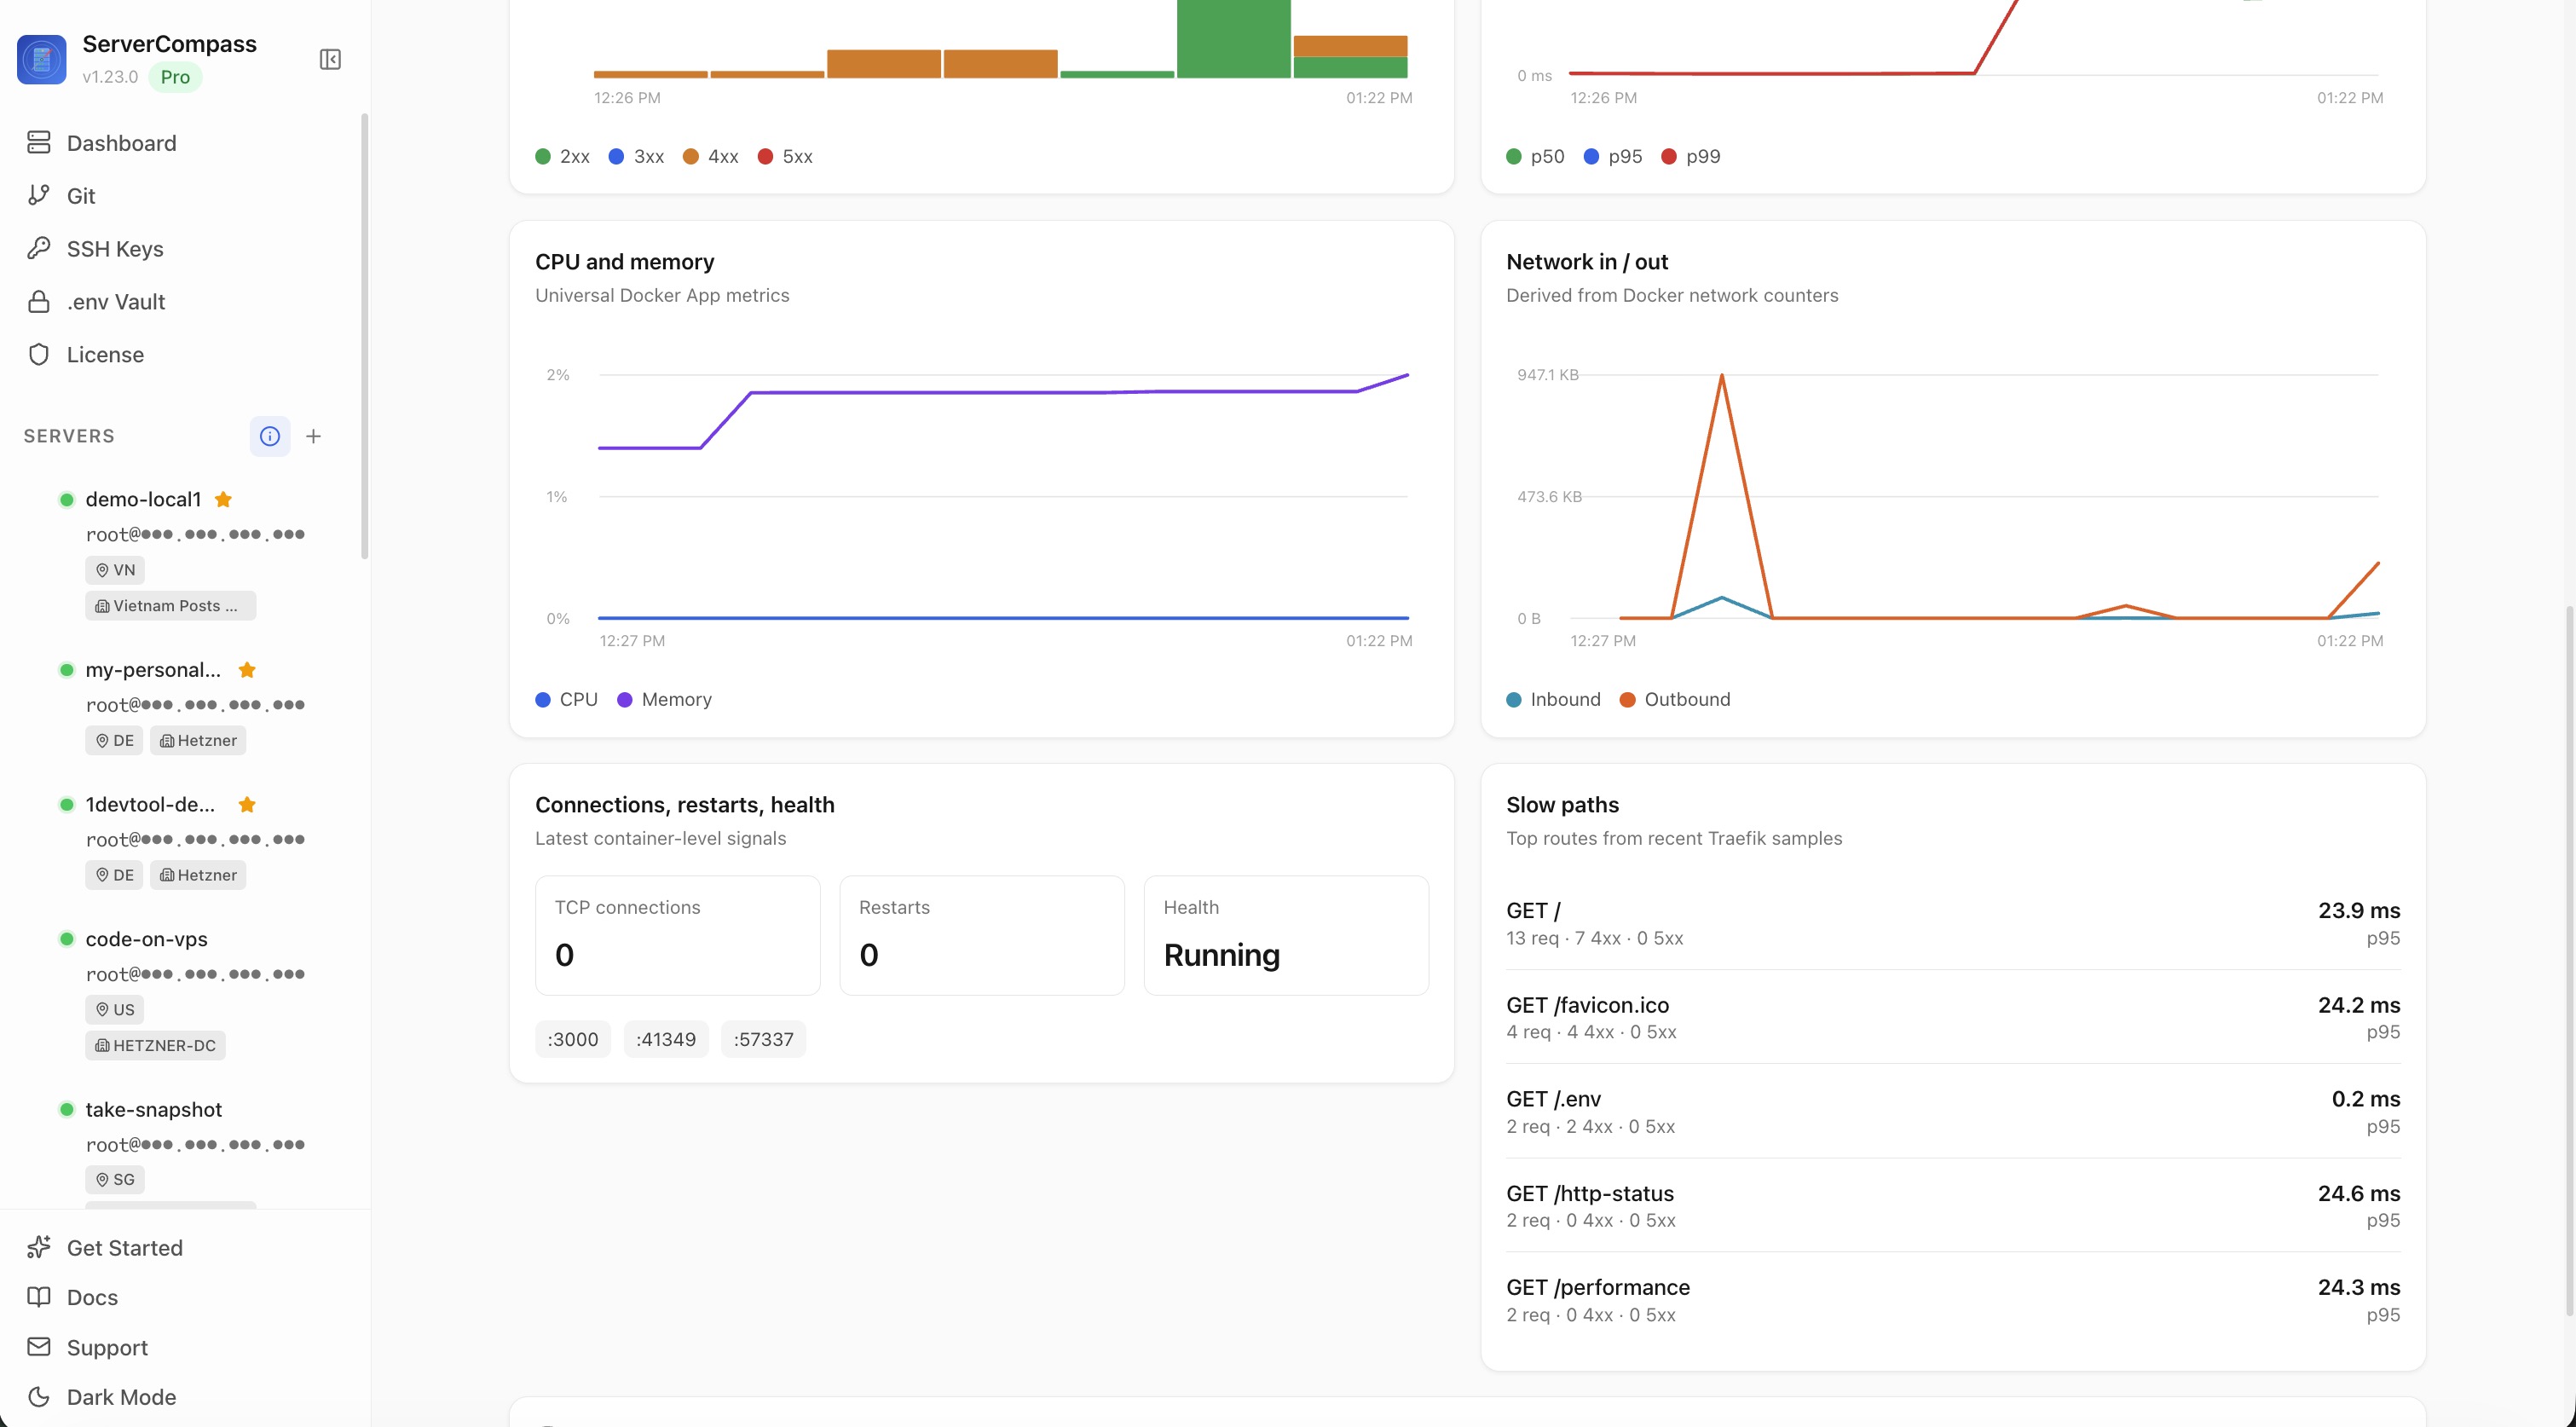
Per-App Metrics Dashboard with status-code distribution, response percentiles, container health, and slow-path panel
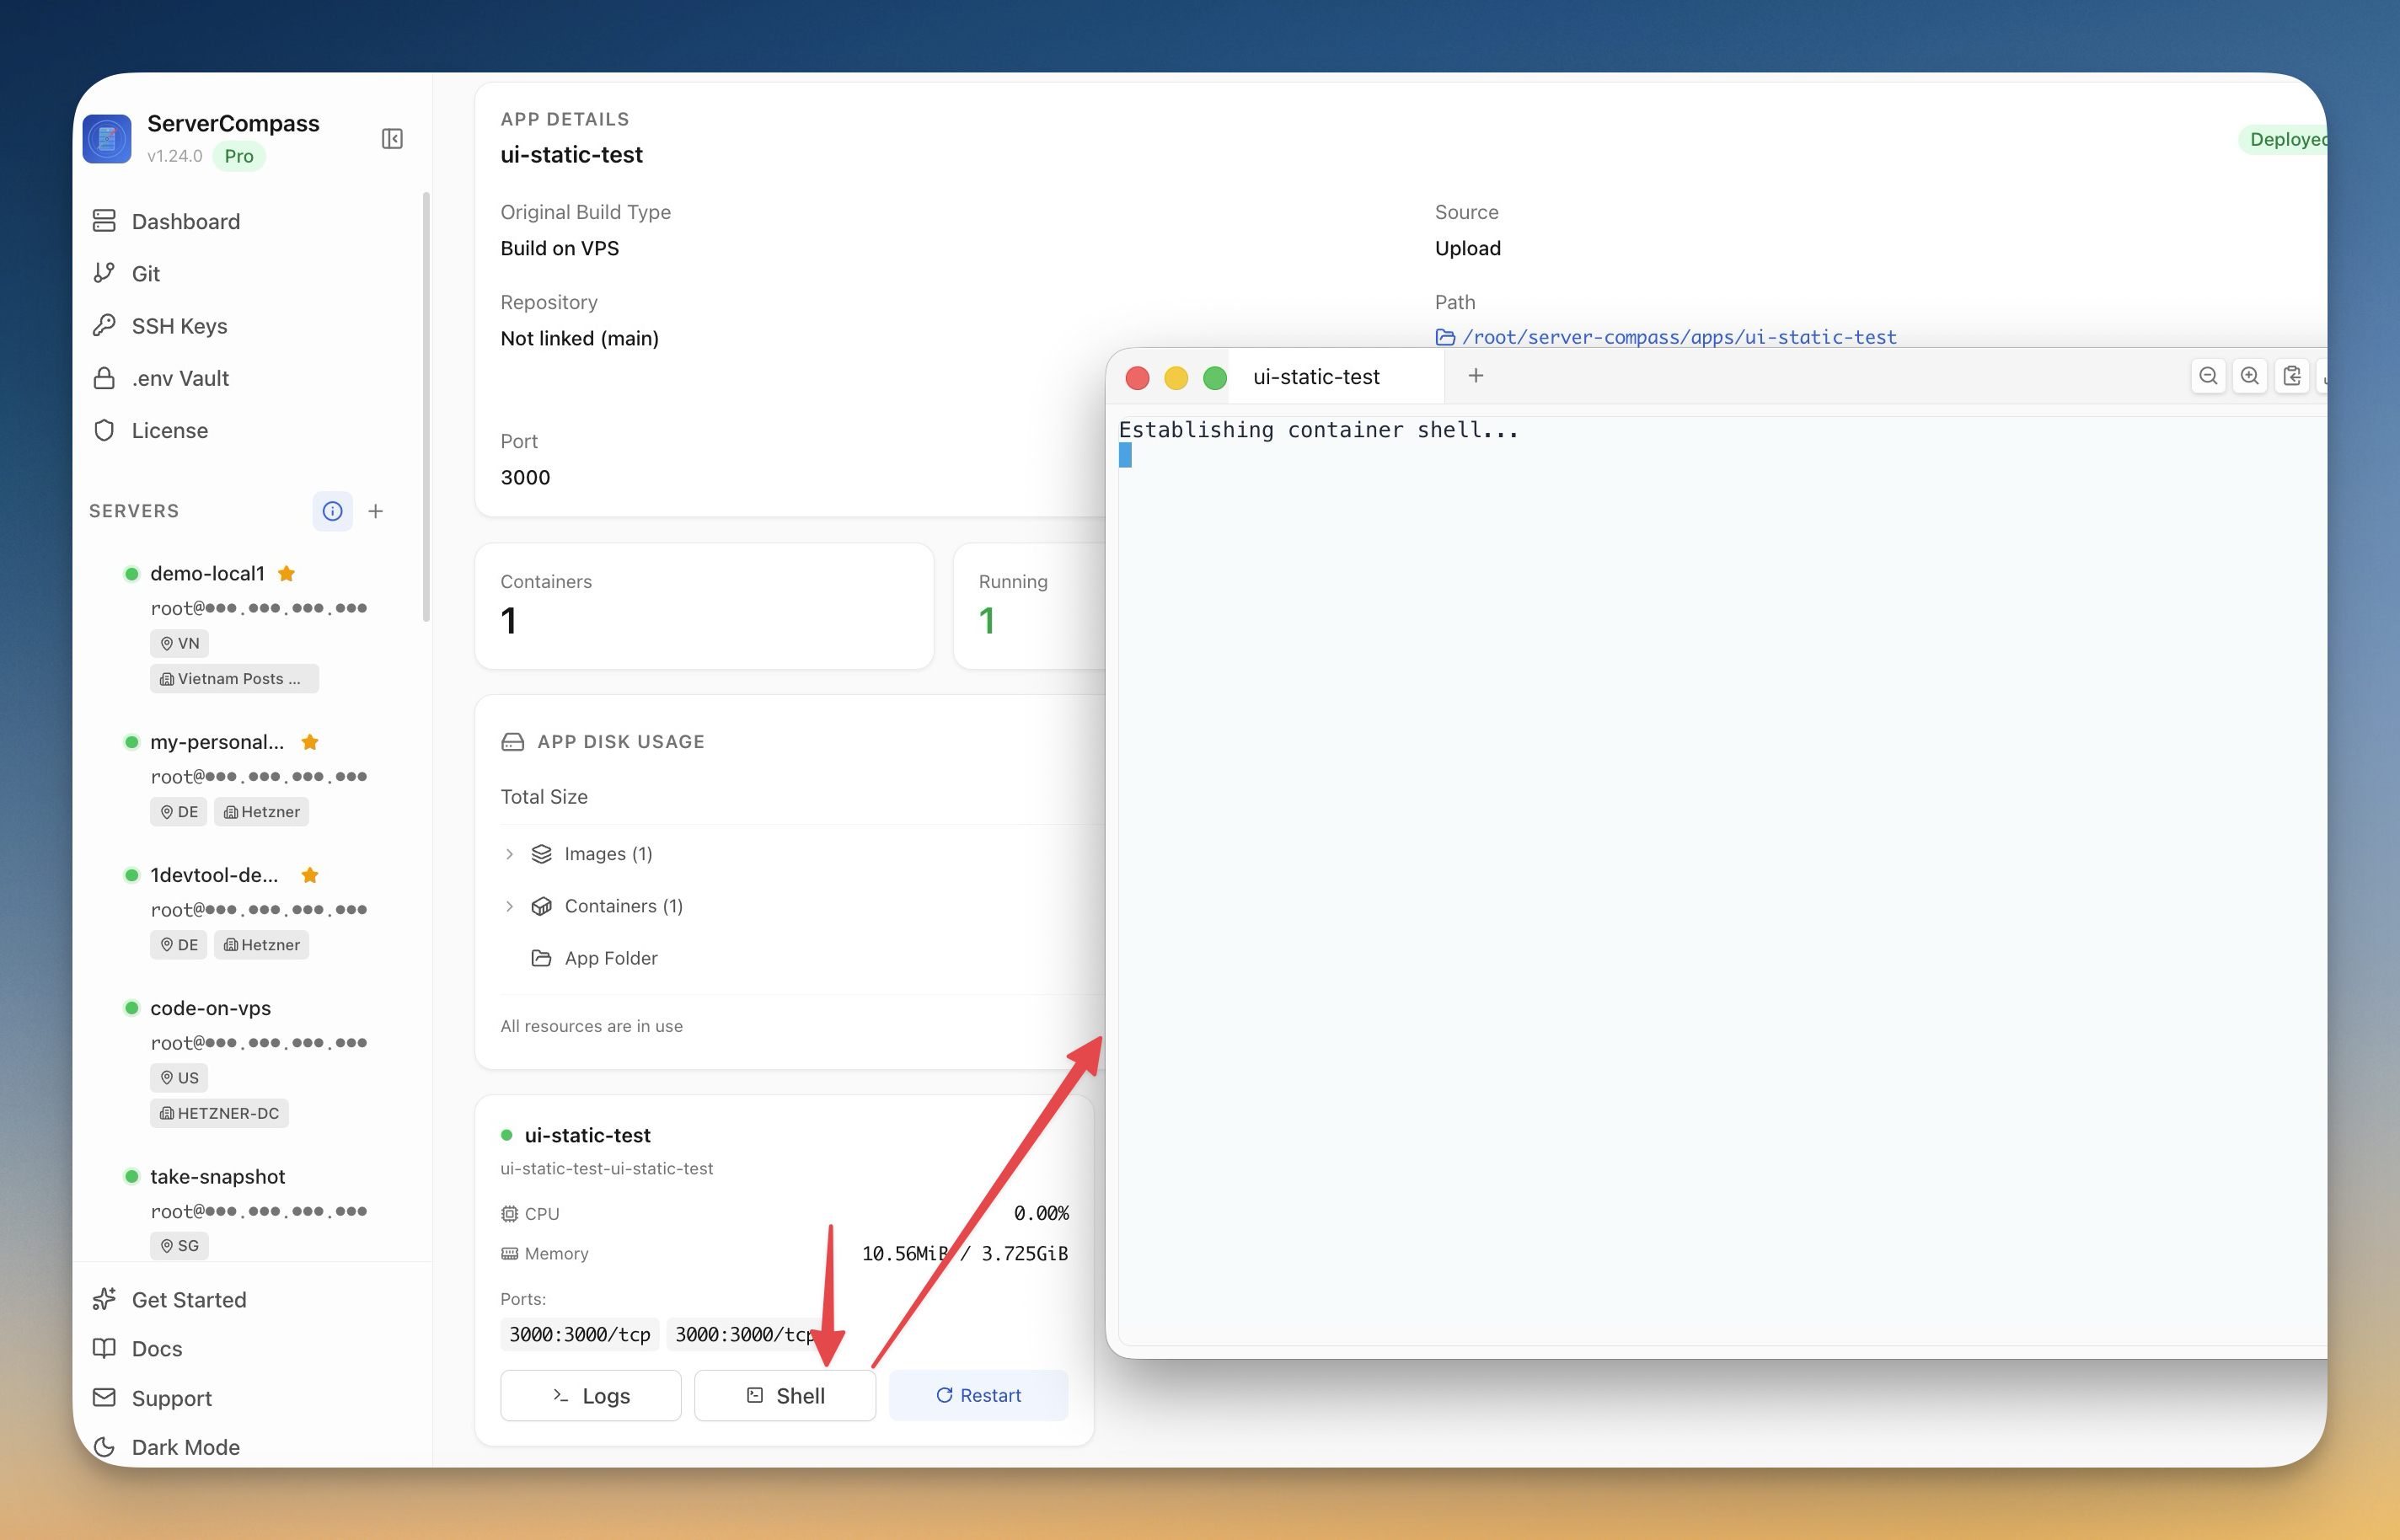
Shell button on App detail opens a terminal window inside the running container
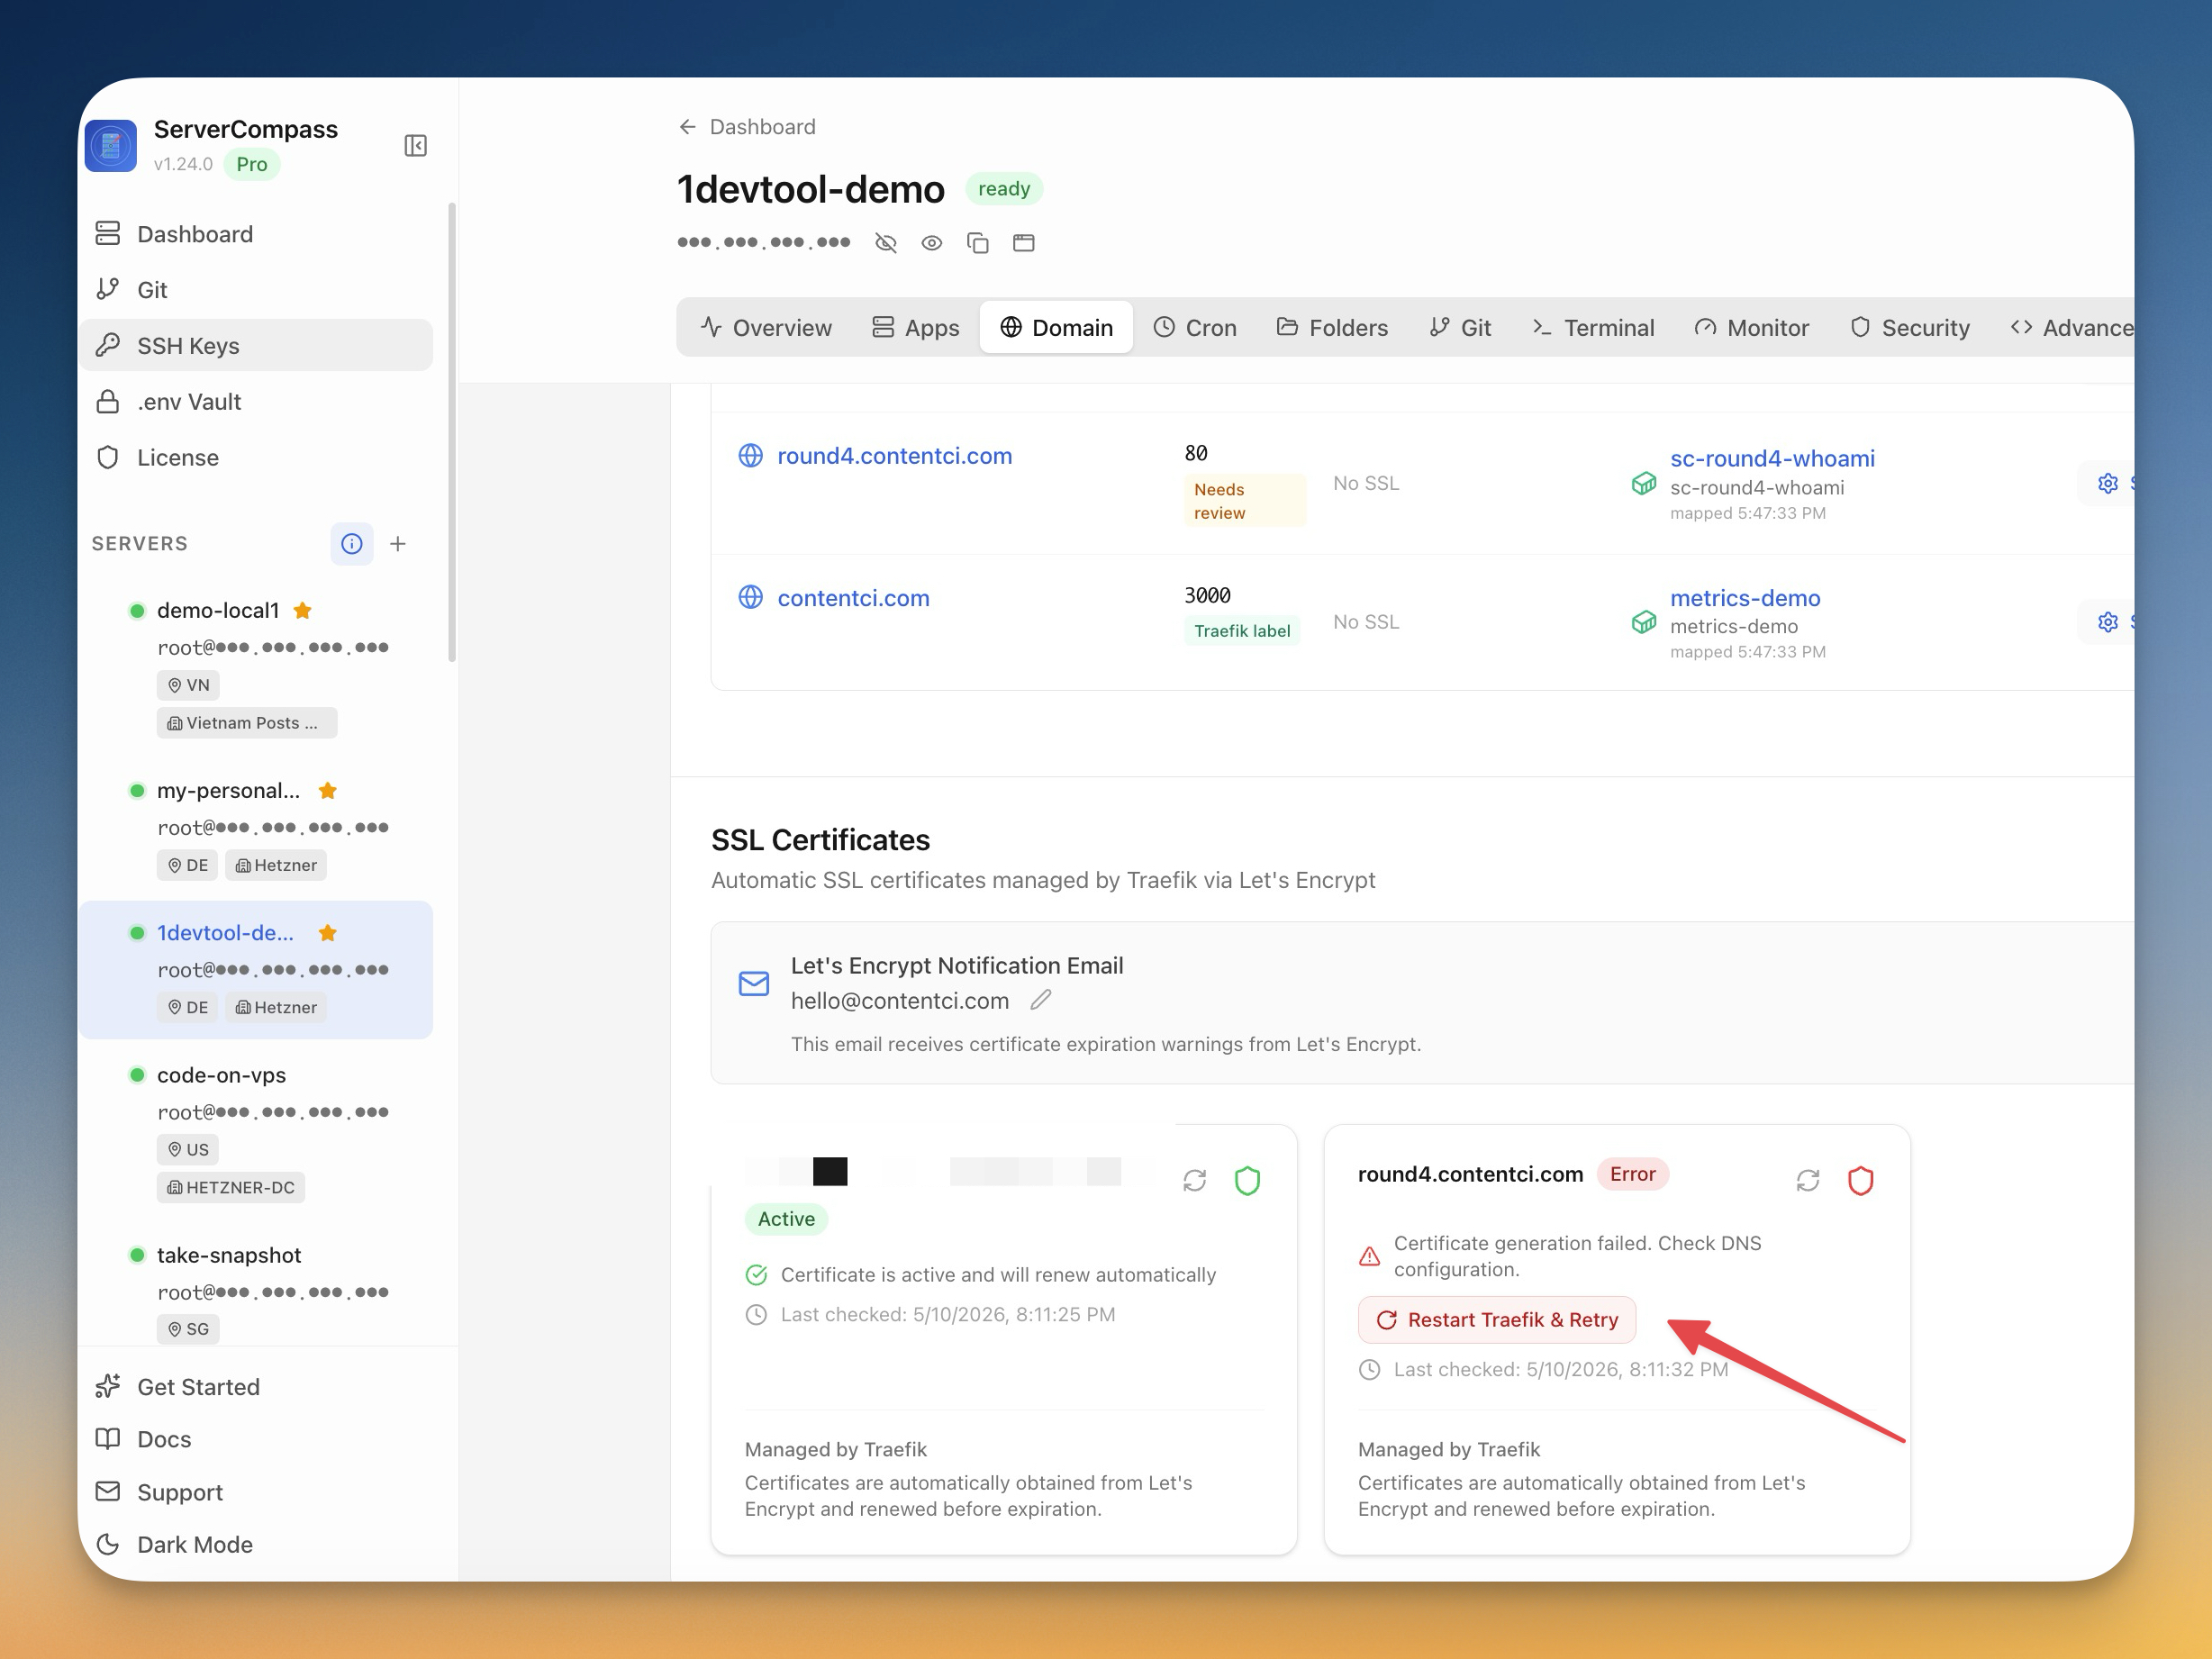
Domain tab showing an active Let's Encrypt SSL certificate alongside a failed cert with a Restart Traefik & Retry action