Kubernetes Dashboard
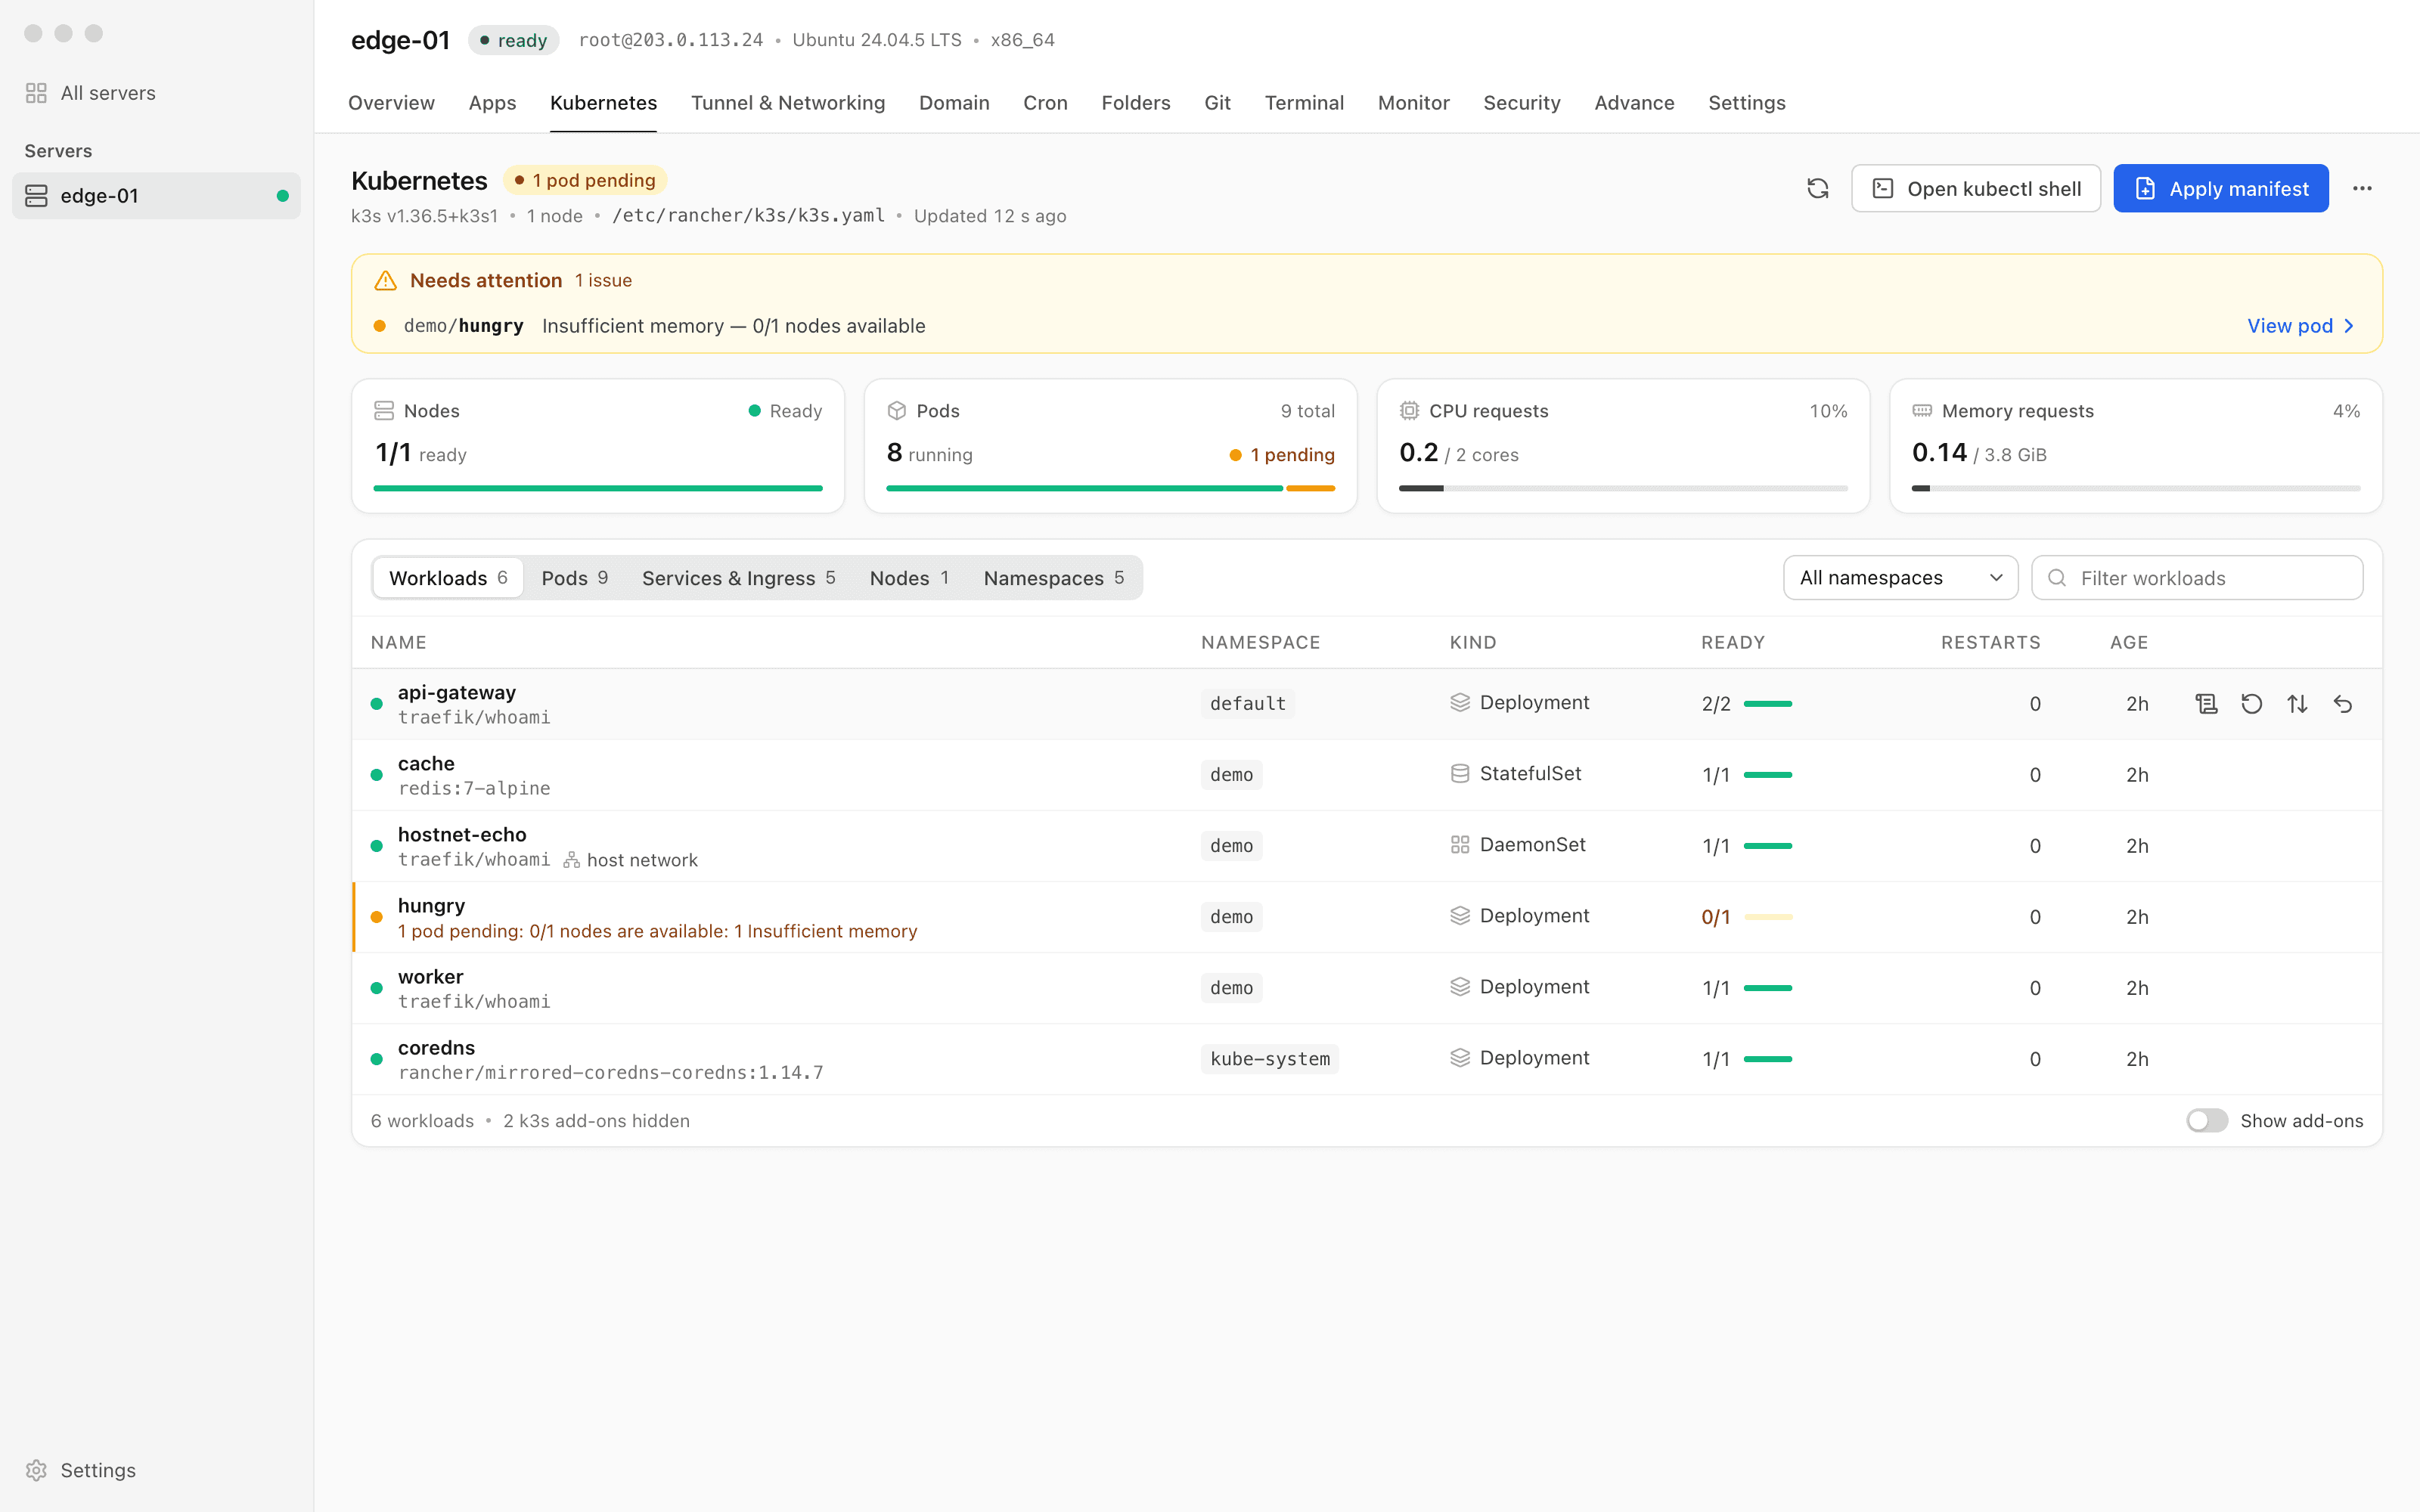
See and run the Kubernetes cluster on your server from a tab next to Apps and Terminal, with failing and pending workloads listed first. Read pod logs, restart, scale, roll back and apply manifests behind a server-side dry run, without typing kubectl.
Getting Started with Kubernetes Dashboard
Kubernetes Dashboard replaces complex workflows with a few clicks. Here's the process.
Let Server Compass find the cluster
One SSH probe looks for k3s, k0s, MicroK8s and kubeadm and their kubeconfigs, then shows the Kubernetes tab once the cluster answers.
Start with Needs attention
Nodes not ready, workloads short of replicas and pods in CrashLoopBackOff, ImagePullBackOff or Pending are listed with a short reason and a link to the pod.
Act from the row
Restart (rollout restart), Scale with the exact kubectl scale command shown, Roll back to a previous revision, View logs, or Delete pod.
Apply manifests behind a dry run
Apply manifest runs a server-side dry run first and unlocks Apply only for that exact text. Open kubectl shell opens the Terminal with KUBECONFIG set.
Doing It Manually Without Kubernetes Dashboard
Think Kubernetes Dashboard is overkill? Here's the alternative: raw terminal commands and manual config files.
Find what is unhealthy
List every pod in every namespace, then describe the one that looks wrong and scroll to its events.
kubectl get pods -A | grep -v Running
kubectl describe pod <pod> -n <namespace>Read the crashed container's logs
The current container has only just restarted, so the useful output is in the previous instance.
kubectl logs <pod> -n <namespace> --previous --tail=200Scale or roll back the owner
Work out which Deployment owns the pod, then scale it or roll it back to a known revision.
kubectl scale deployment/<name> --replicas=3 -n <namespace>
kubectl rollout history deployment/<name> -n <namespace>
kubectl rollout undo deployment/<name> --to-revision=2 -n <namespace>Apply a manifest with a dry run first
Validate against the API server before anything changes.
kubectl apply -f app.yaml --dry-run=server
kubectl apply -f app.yaml
Skip the dry run and a manifest with several objects can apply half of them before an error stops the rest.
Let Server Compass Handle It
Kubernetes Dashboard isn't just faster—it's safer. No typos, no forgotten flags, no accidental disasters.
- Visual interface
- No terminal needed
- Built-in error handling
- Works on any VPS
What Kubernetes Dashboard Can Do
Everything you need for server management in one integrated tool, replacing complex CLI commands and manual configuration.
Get StartedWhy Kubernetes Dashboard Matters
Server management shouldn't require a DevOps team. Kubernetes Dashboard makes professional-grade server management accessible to everyone.
At-a-Glance Monitoring
Kubernetes Dashboard shows CPU, RAM, disk, and network metrics in a single dashboard view.
Quick Actions
Kubernetes Dashboard provides one-click package updates, Docker setup, and system configuration.
Multi-Server Support
Kubernetes Dashboard manages unlimited VPS servers from one application with saved connections.
Resource Trending
Kubernetes Dashboard tracks resource usage over time so you can plan capacity and identify bottlenecks.
Common Questions About Kubernetes Dashboard
Common questions about Kubernetes Dashboard in Server Compass
How do I access Kubernetes Dashboard in Server Compass?
Kubernetes Dashboard is available in the Server Management section of Server Compass. Simply connect to your server, navigate to Server Management, and you'll find Kubernetes Dashboard ready to use. No additional setup or plugins required.
Does Kubernetes Dashboard require any server-side installation?
No. Server Compass operates as a desktop application that connects to your server via SSH. Kubernetes Dashboard works through this connection without installing any agents or packages on your server (except the optional monitoring agent for resource tracking).
Is Kubernetes Dashboard included in all Server Compass plans?
Yes. Every Server Compass feature, including Kubernetes Dashboard, is included with the one-time $29 payment. There are no tier restrictions, add-ons, or per-server fees. You get all 155+ features for all your servers.
Can I use Kubernetes Dashboard with any VPS provider?
Kubernetes Dashboard works with any VPS or dedicated server that supports SSH access and Docker. This includes DigitalOcean, Hetzner, Vultr, Linode, AWS EC2, Google Cloud, Azure, and any other provider. It also works with local servers and homelab setups.
What makes Kubernetes Dashboard different from command-line alternatives?
Kubernetes Dashboard provides a visual, intuitive interface that replaces complex CLI commands and configuration files. You get real-time feedback, safety confirmations, and a consistent experience across all your servers without memorizing syntax or writing scripts.
More Server Management Features
Explore other server management capabilities in Server Compass
Server Overview Dashboard
At-a-glance view of CPU, RAM, and disk usage. See OS info, auth method, location, and provider details.
Resource Monitoring
Real-time CPU, memory, and disk usage graphs. Track resource trends and identify bottlenecks.
System Packages
List and manage installed APT packages, update individual ones, or run a system-wide upgrade. Install Recommended covers the baseline a server needs — including sudo and jq — and an Available Packages section installs optional software like Caddy with its repository set up for you.
Port Management
View all open ports and the services using them. Identify conflicts and manage port allocations.
Try Kubernetes Dashboard Today
Download Server Compass and get access to Kubernetes Dashboard along with 154 other features. One-time $29 payment. No subscriptions. No per-server fees.