Metric History
Store CPU, memory, disk and load samples on the server itself and review them in Monitoring. Choose the data directory and how many days to keep, and optionally forward every sample as JSON to an HTTP receiver you own.
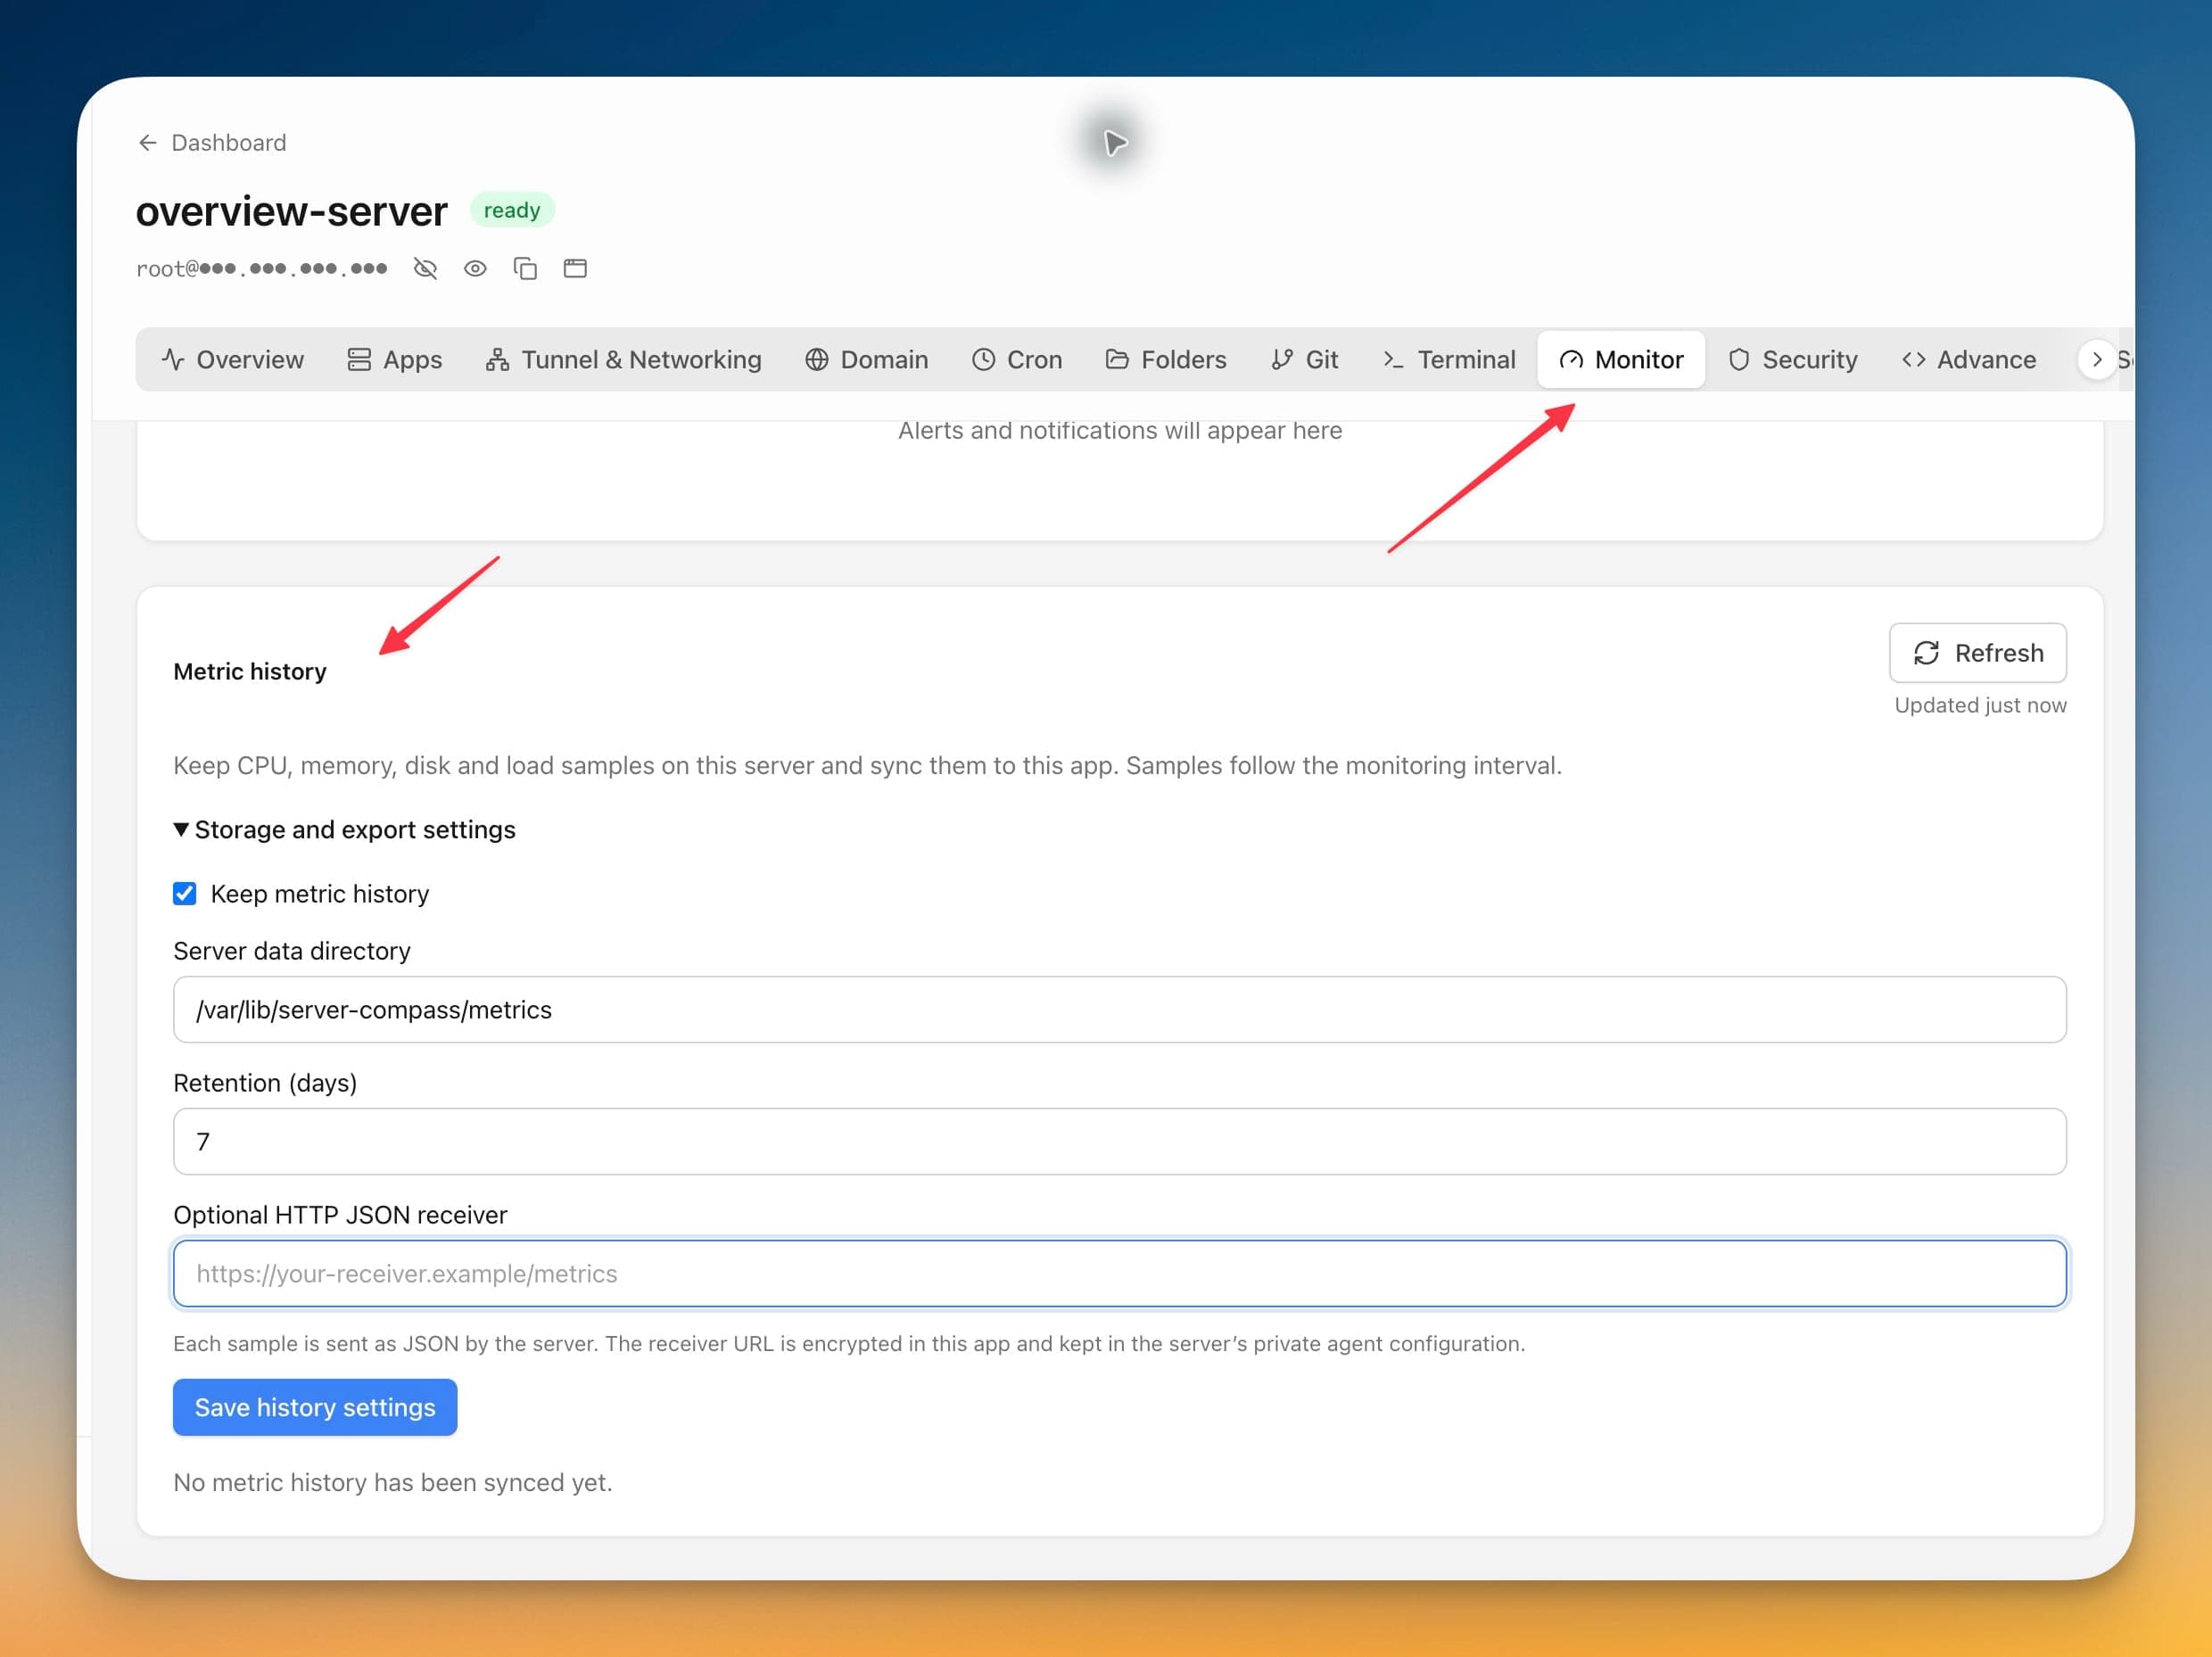
Using Metric History in Server Compass
Metric History replaces complex workflows with a few clicks. Here's the process.
Open Metric history
Under the Monitor tab, expand Storage and export settings and tick Keep metric history.
Choose where and how long
Set the Server data directory and Retention (days). Samples follow the monitoring interval you configured for the agent.
Optionally forward the samples
Add an Optional HTTP JSON receiver and each sample is POSTed as JSON by the server. The receiver URL is encrypted in the app.
Review or export
Load the synced history in Monitoring, or Export JSON to pull the samples out for your own analysis.
Manual Alternative to Metric History
Without Metric History, you'd need to SSH into your server and run these commands manually. Every. Single. Time.
Sample by hand
Reading load and memory once is easy; keeping it is the work.
uptime && free -m && df -h /Schedule the collection
A cron entry appending to a file is the usual improvised version.
echo '* * * * * echo "$(date -Is) $(cat /proc/loadavg)" >> /var/log/load.log' | crontab -Stop it eating the disk
Without rotation, the improvised log is a future disk-full incident.
sudo tee /etc/logrotate.d/loadlog <<'EOF'
/var/log/load.log { daily rotate 7 compress missingok notifempty }
EOF
Unrotated metric logs on a small VPS are a common cause of a full root filesystem.
Skip All That. Use Server Compass.
Server Compass replaces all those commands with a beautiful UI. Metric History just works—click, configure, done.
- Visual interface
- No terminal needed
- Built-in error handling
- Works on any VPS
Everything Metric History Offers
Everything you need for monitoring & alerts in one integrated tool, replacing complex CLI commands and manual configuration.
Get StartedWhy Metric History Matters
Server management shouldn't require a DevOps team. Metric History makes professional-grade monitoring & alerts accessible to everyone.
Real-Time Insights
Metric History streams data live so you catch issues the moment they happen, not hours later.
Instant Alerts
Metric History notifies you through your preferred channels before small issues become outages.
Actionable Data
Metric History doesn't just show metrics; it highlights what needs attention and suggests next steps.
Complete Audit Trail
Metric History logs every event, giving you the forensic data you need for debugging and compliance.
Common Questions About Metric History
Common questions about Metric History in Server Compass
How do I access Metric History in Server Compass?
Metric History is available in the Monitoring & Alerts section of Server Compass. Simply connect to your server, navigate to Monitoring & Alerts, and you'll find Metric History ready to use. No additional setup or plugins required.
Does Metric History require any server-side installation?
No. Server Compass operates as a desktop application that connects to your server via SSH. Metric History works through this connection without installing any agents or packages on your server (except the optional monitoring agent for resource tracking).
Is Metric History included in all Server Compass plans?
Yes. Every Server Compass feature, including Metric History, is included with the one-time $29 payment. There are no tier restrictions, add-ons, or per-server fees. You get all 152+ features for all your servers.
Can I use Metric History with any VPS provider?
Metric History works with any VPS or dedicated server that supports SSH access and Docker. This includes DigitalOcean, Hetzner, Vultr, Linode, AWS EC2, Google Cloud, Azure, and any other provider. It also works with local servers and homelab setups.
What makes Metric History different from command-line alternatives?
Metric History provides a visual, intuitive interface that replaces complex CLI commands and configuration files. You get real-time feedback, safety confirmations, and a consistent experience across all your servers without memorizing syntax or writing scripts.
More Monitoring & Alerts Features
Explore other monitoring & alerts capabilities in Server Compass
Real-Time Container Logs
Stream container logs in real-time with beautiful formatting. Filter, search, and follow logs without SSH sessions.
Monitoring Agent
Lightweight monitoring agent for continuous resource tracking. Install with one click and view metrics in your dashboard.
Custom Alert Rules
Create threshold-based alert rules for CPU, memory, disk, and custom metrics. Get notified before problems escalate.
Notification Channels
Configure email, webhook, and other notification channels. Test connectivity before relying on alerts in production.
Try Metric History Today
Download Server Compass and get access to Metric History along with 151 other features. One-time $29 payment. No subscriptions. No per-server fees.