ドキュメントに戻る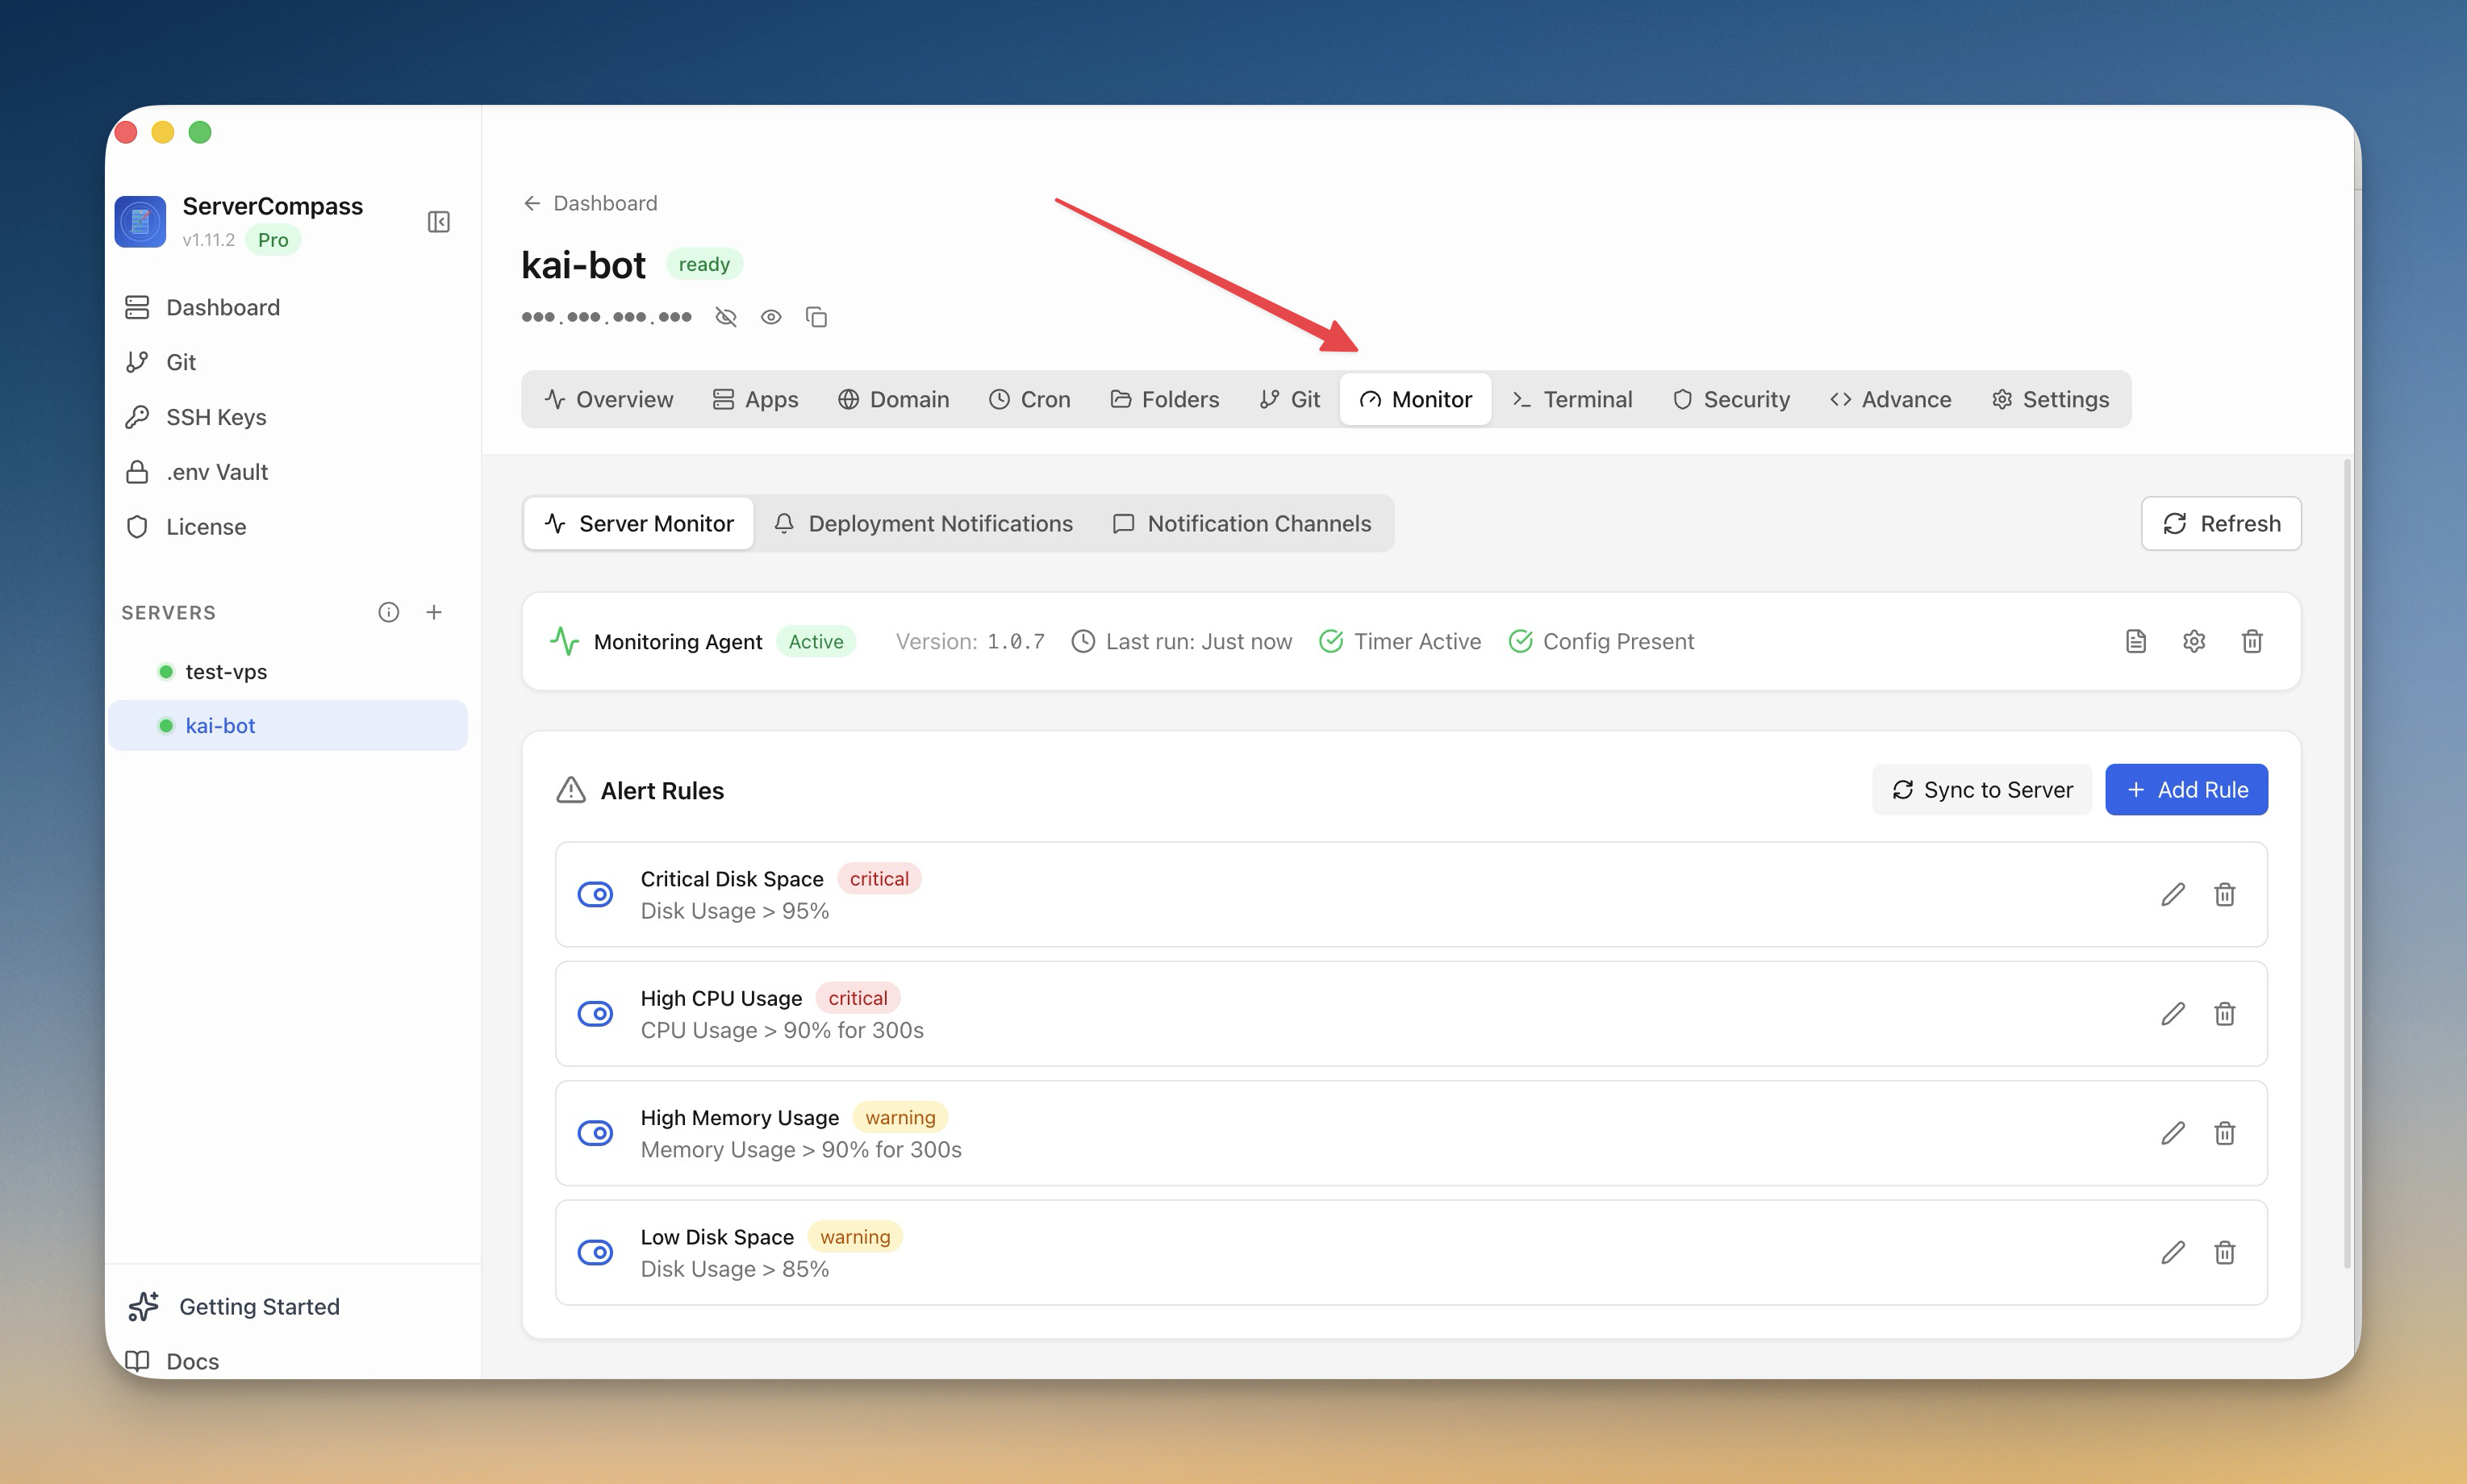
モニタリングとアラート
監視を設定
監視エージェントをインストールし、サーバーのアラートを設定します。
Intermediate6 min readUpdated 2024-02-01
監視エージェント
オプションの監視エージェントが提供:
- 継続的なリソース追跡
- 履歴メトリクスとグラフ
- 詳細なパフォーマンスデータ
- アラートルールの基礎
エージェントをインストール
- 監視タブに移動
- 「エージェントをインストール」をクリック
- インストールを待つ(1〜2 分)
- エージェントがすぐにメトリクス収集を開始
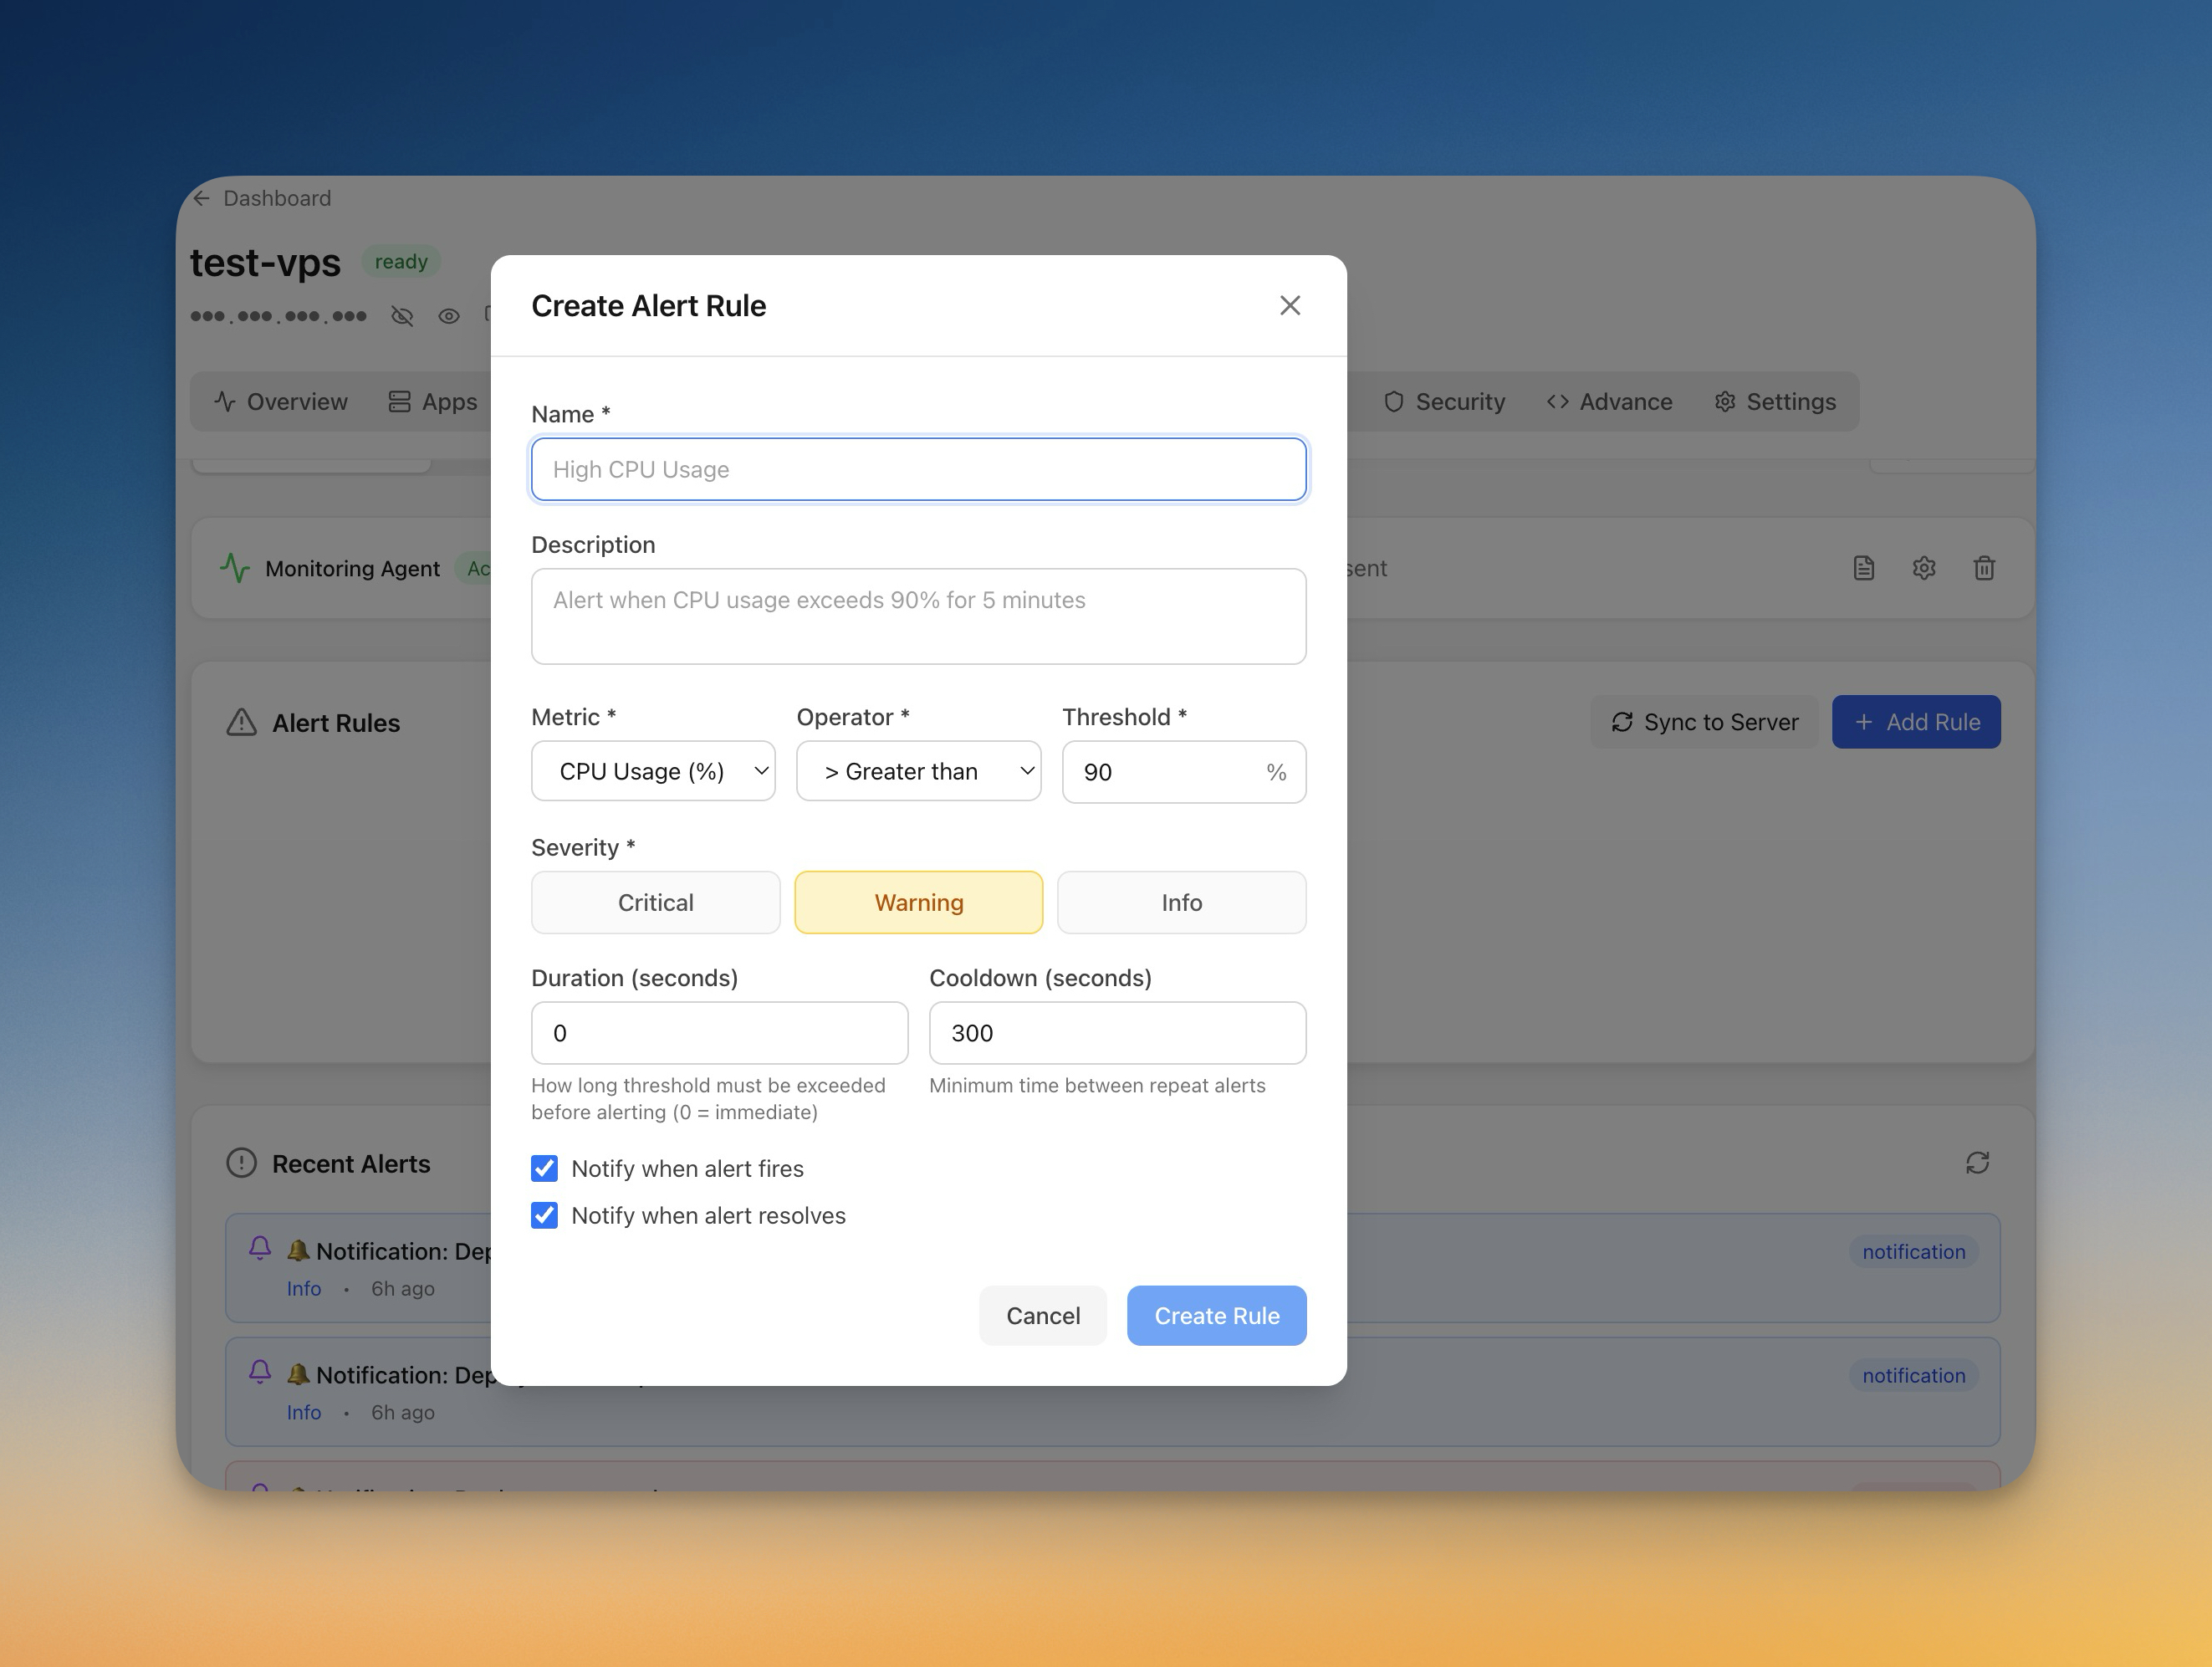
アラートルールを作成
アラートを設定:
- 監視 > アラートに移動
- 「ルールを追加」をクリック
- メトリクスを選択(CPU、メモリ、ディスク)
- 閾値と期間を設定
- 通知チャンネルを選択
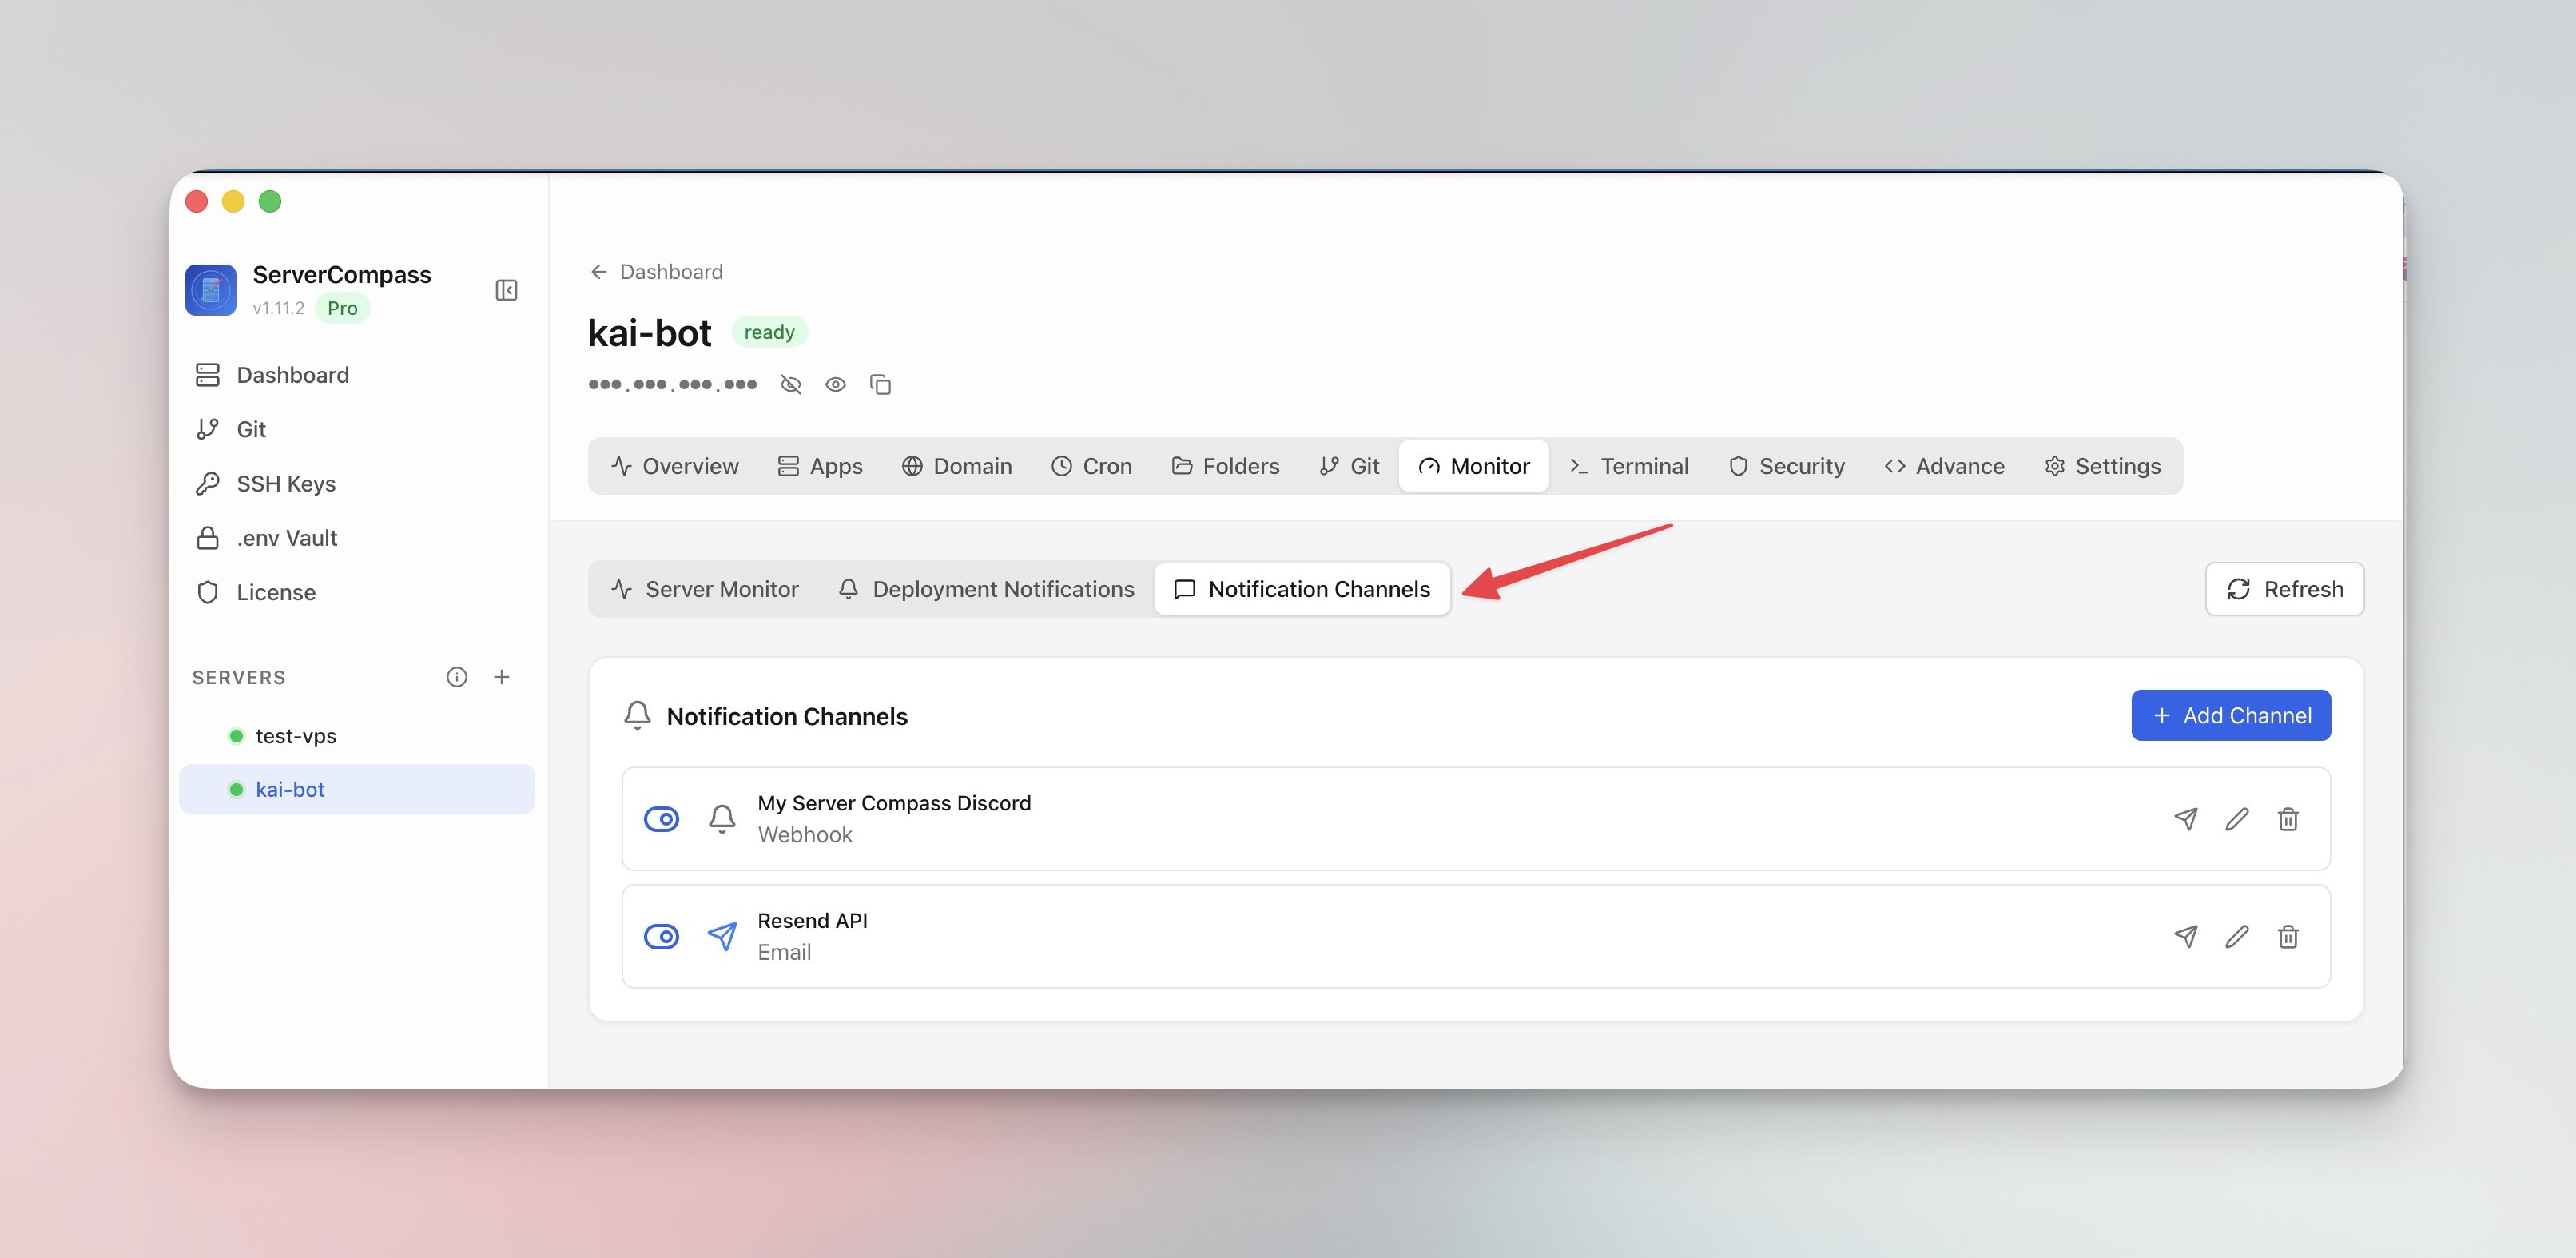
通知チャンネル
アラートを受信する場所を設定:
- メール:直接メール通知
- Webhook:URL に POST
- 依存する前にチャンネルをテスト
Screenshots
Related Features
Monitoring Agent
Lightweight monitoring agent for continuous resource tracking. Install with one click and view metrics in your dashboard.
Custom Alert Rules
Create threshold-based alert rules for CPU, memory, disk, and custom metrics. Get notified before problems escalate.
Notification Channels
Configure email, webhook, and other notification channels. Test connectivity before relying on alerts in production.
Ready to try Server Compass?
Download the app and deploy your first application in under 5 minutes.
Download Server Compass