Memahami Dashboard Server
Pelajari cara menggunakan dashboard overview server untuk memantau resource dan mengelola VPS.
Layout dashboard
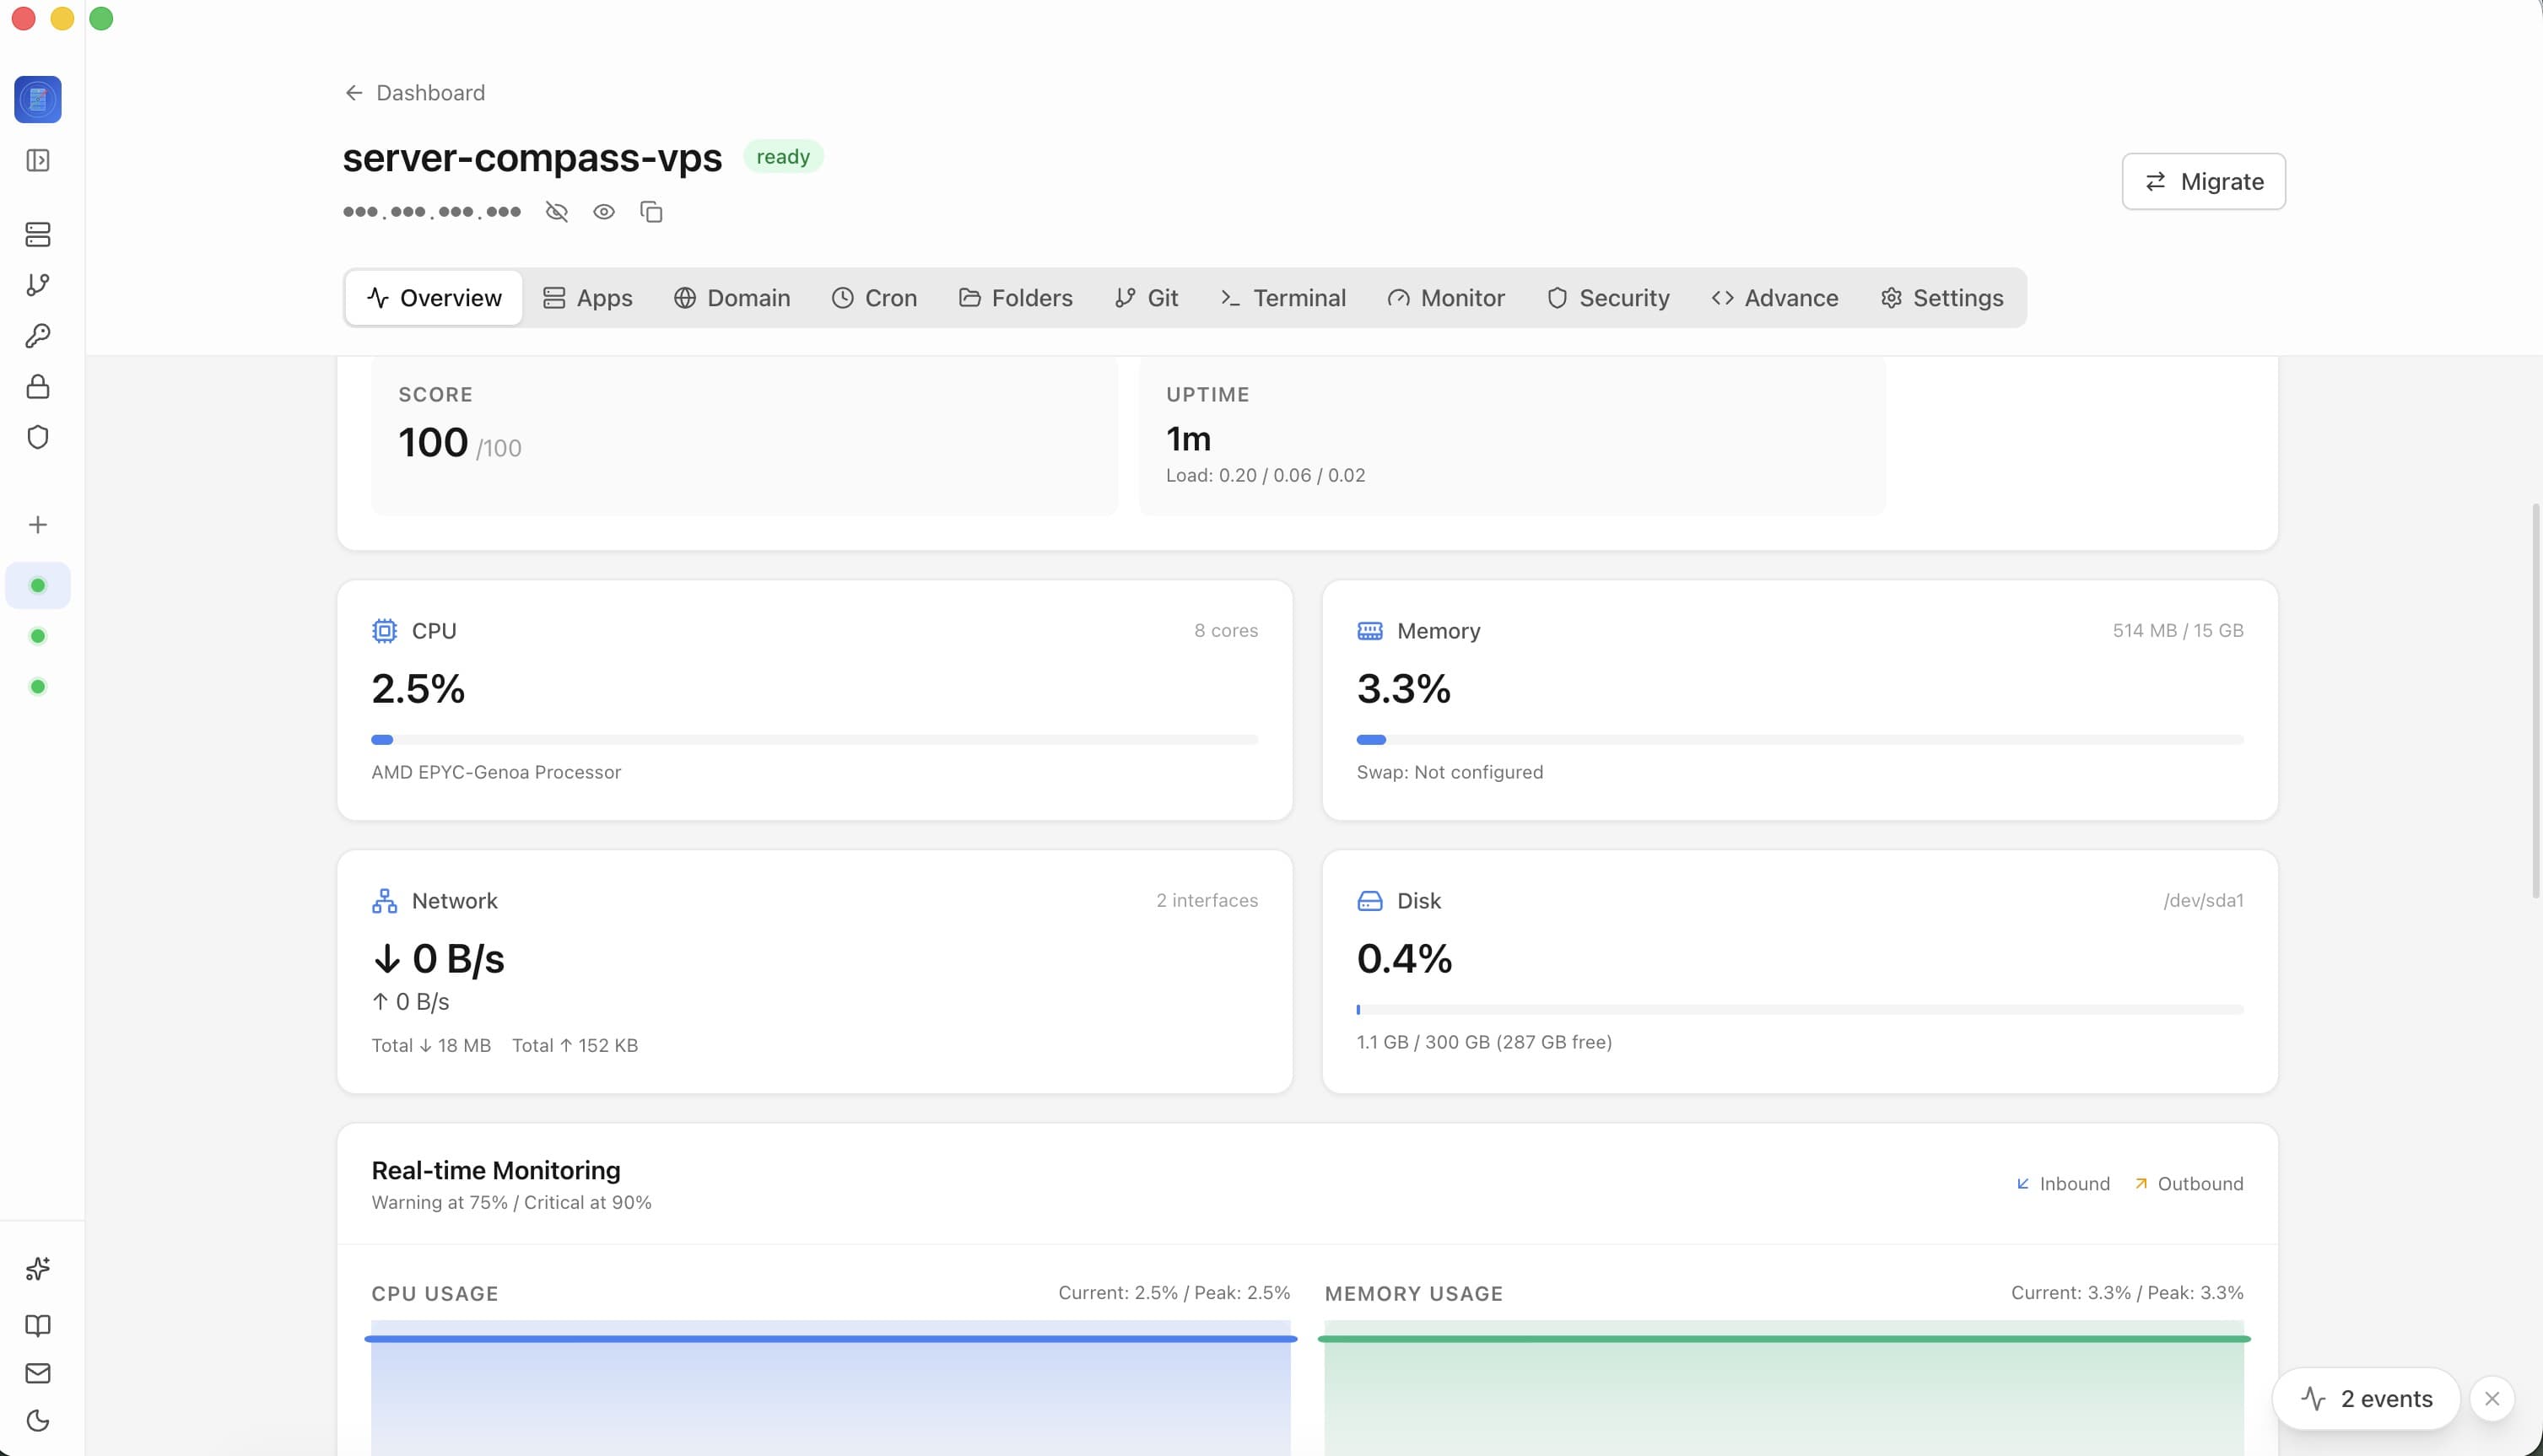
Dashboard server menampilkan:
- Resource Usage: CPU, RAM, dan penggunaan disk sekilas
- Server Info: OS, lokasi, penyedia, uptime
- Quick Actions: Setup Docker, security audit, akses terminal
- Deployed Apps: Daftar semua aplikasi di server ini
Monitoring resource
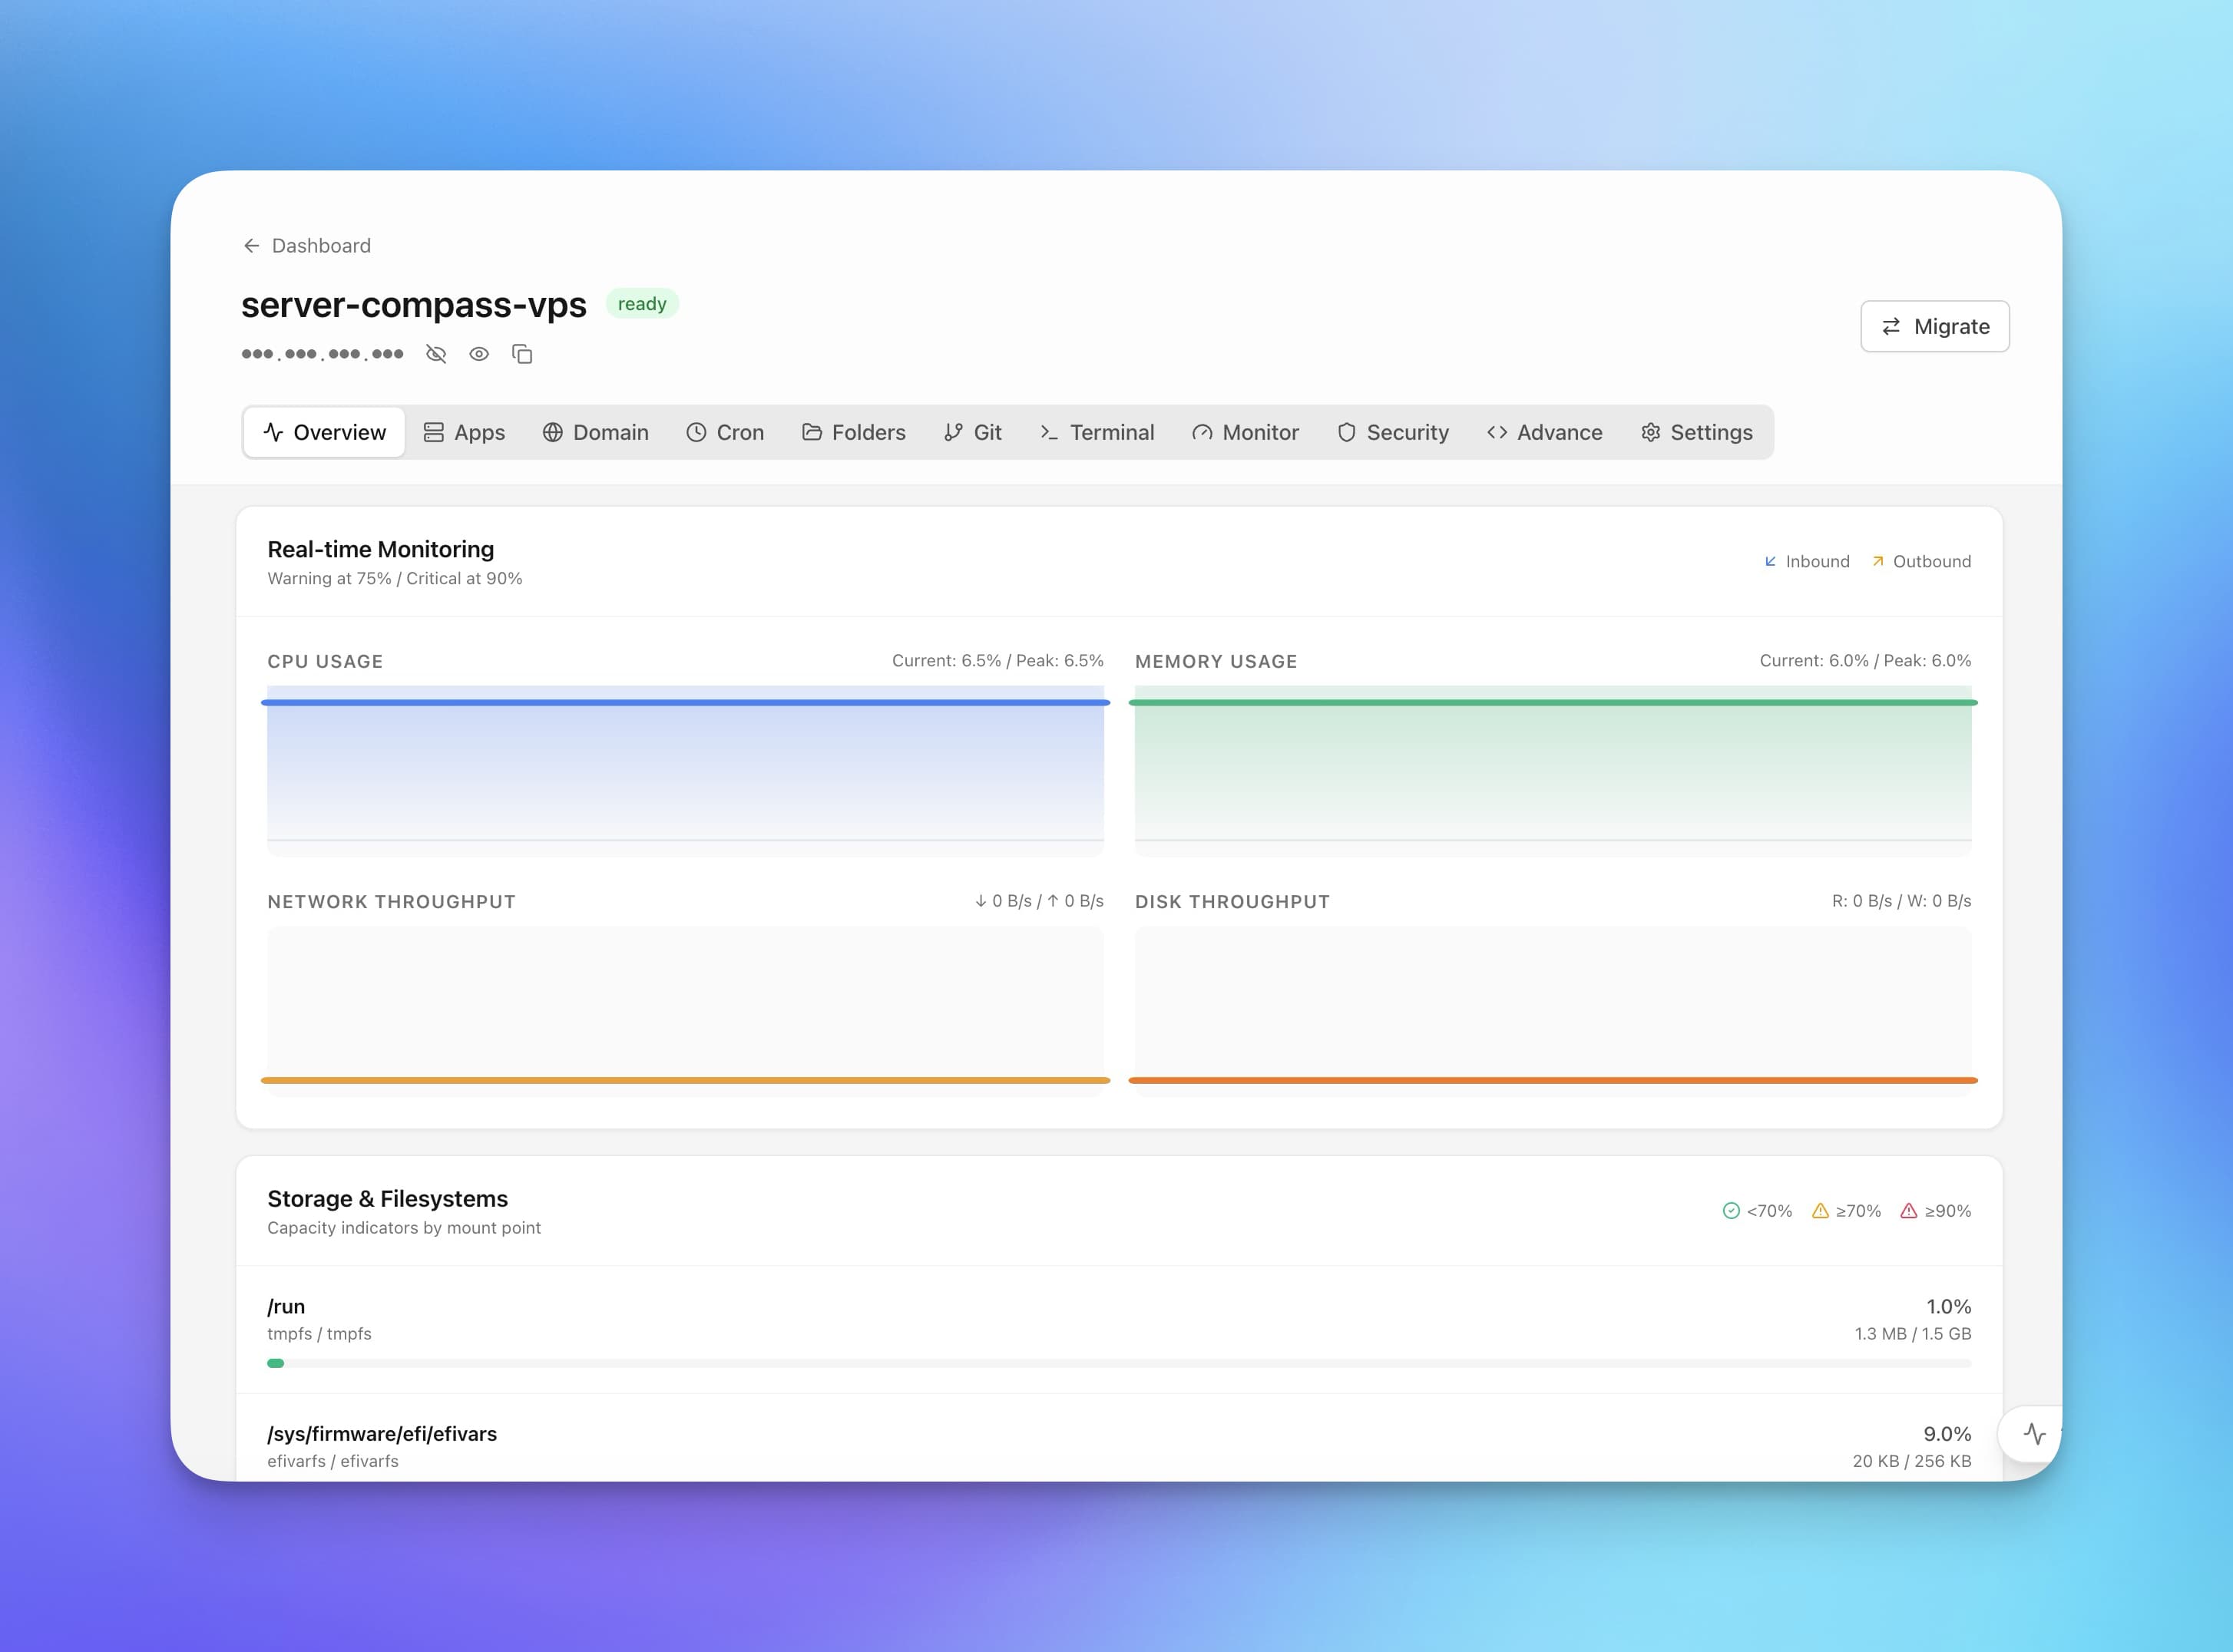
Lihat penggunaan resource real-time:
- CPU: Utilisasi CPU saat ini dan historis
- Memory: RAM yang digunakan vs tersedia
- Disk: Penggunaan storage per partisi
- Network: Penggunaan bandwidth (dengan monitoring agent)
Instal monitoring agent opsional untuk metrik detail dan grafik historis.
Informasi server
Panel info menampilkan:
- Sistem operasi dan versi
- Lokasi server (jika terdeteksi)
- Penyedia VPS
- Alamat IP dan hostname
- Metode autentikasi
- Uptime
Screenshots
Related Features
Server Overview Dashboard
At-a-glance view of CPU, RAM, and disk usage. See OS info, auth method, location, and provider details.
Resource Monitoring
Real-time CPU, memory, and disk usage graphs. Track resource trends and identify bottlenecks.
Disks & Storage
See every disk on your server, with partitions and mount points grouped under each physical disk and attached volumes that were never mounted called out. Mount one from the app, with an optional /etc/fstab entry by UUID and nofail so the server still boots without it.
Ready to try Server Compass?
Download the app and deploy your first application in under 5 minutes.
Download Server Compass