ドキュメントに戻る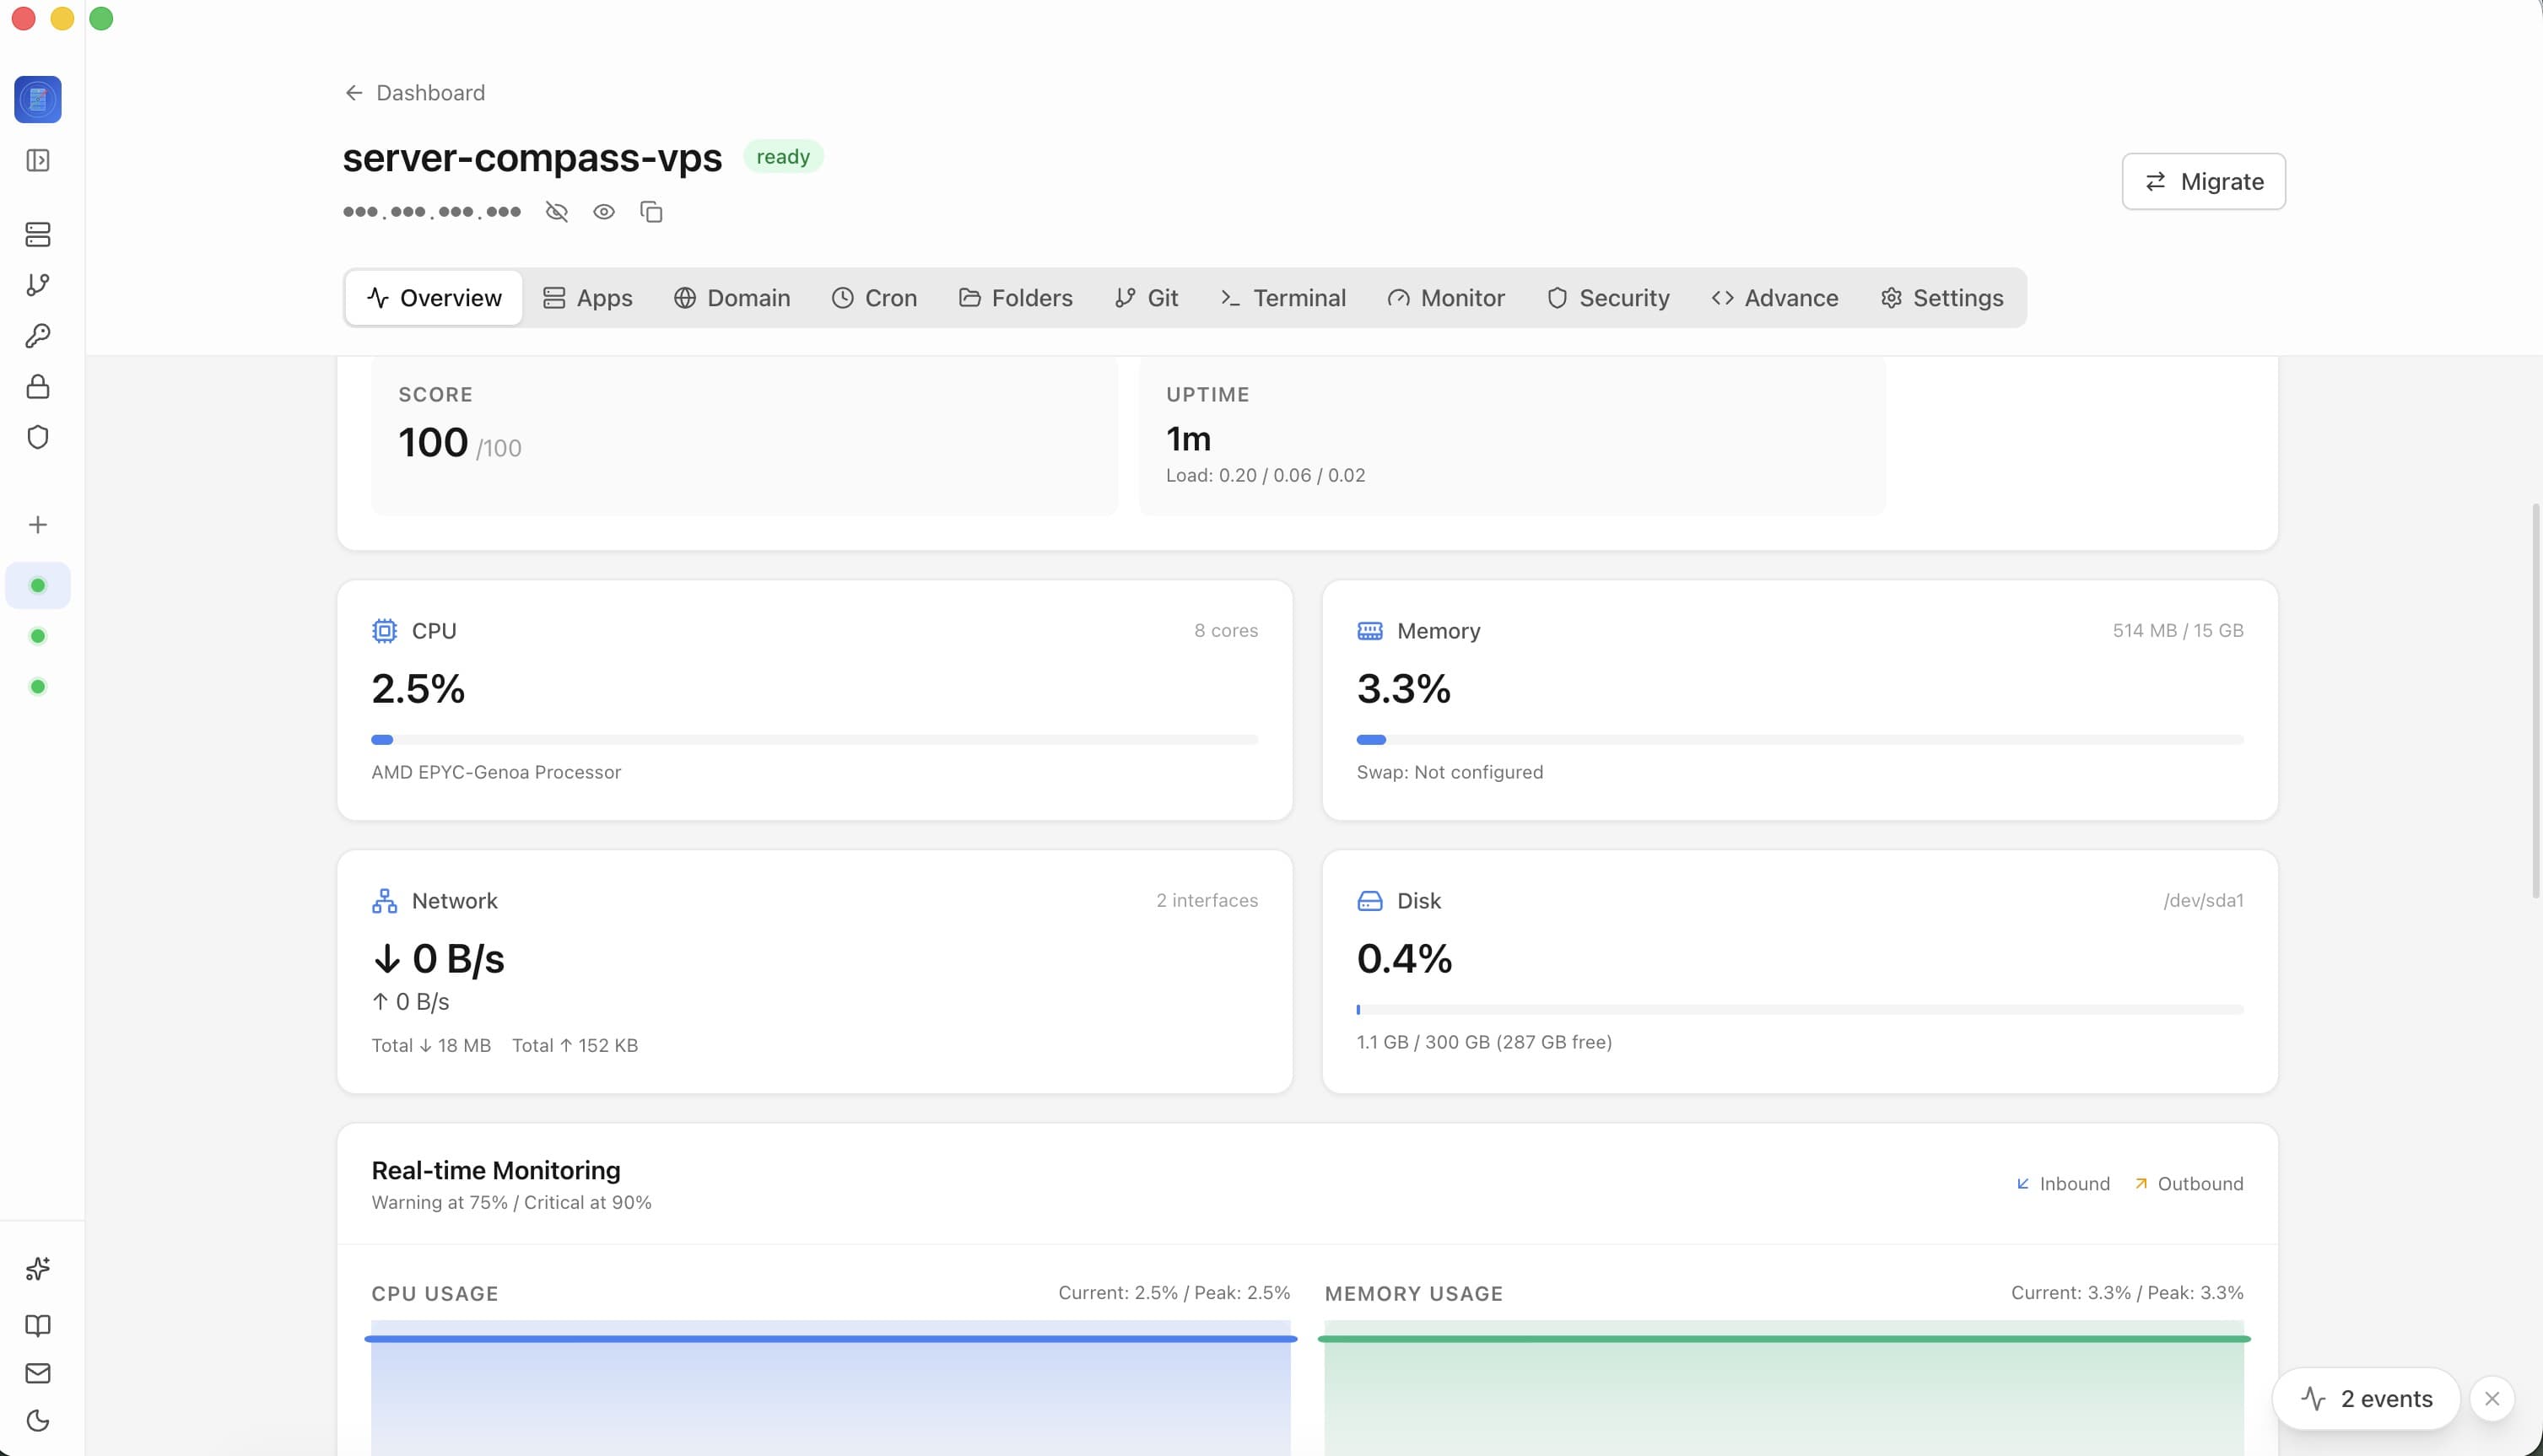
サーバー管理
サーバーダッシュボードを理解
サーバー概覧ダッシュボードを使用してリソースを監視し、VPS を管理する方法を学びます。
Beginner4 min readUpdated 2026-11-02
ダッシュボードレイアウト
サーバーダッシュボードは以下を表示:
- リソース使用状況:CPU、RAM、ディスク使用状況が一目で
- サーバー情報:OS、場所、プロバイダー、稼働時間
- クイックアクション:Docker 設定、セキュリティ監査、ターミナルアクセス
- デプロイ済みアプリ:このサーバー上のすべてのアプリケーションリスト
リソース監視
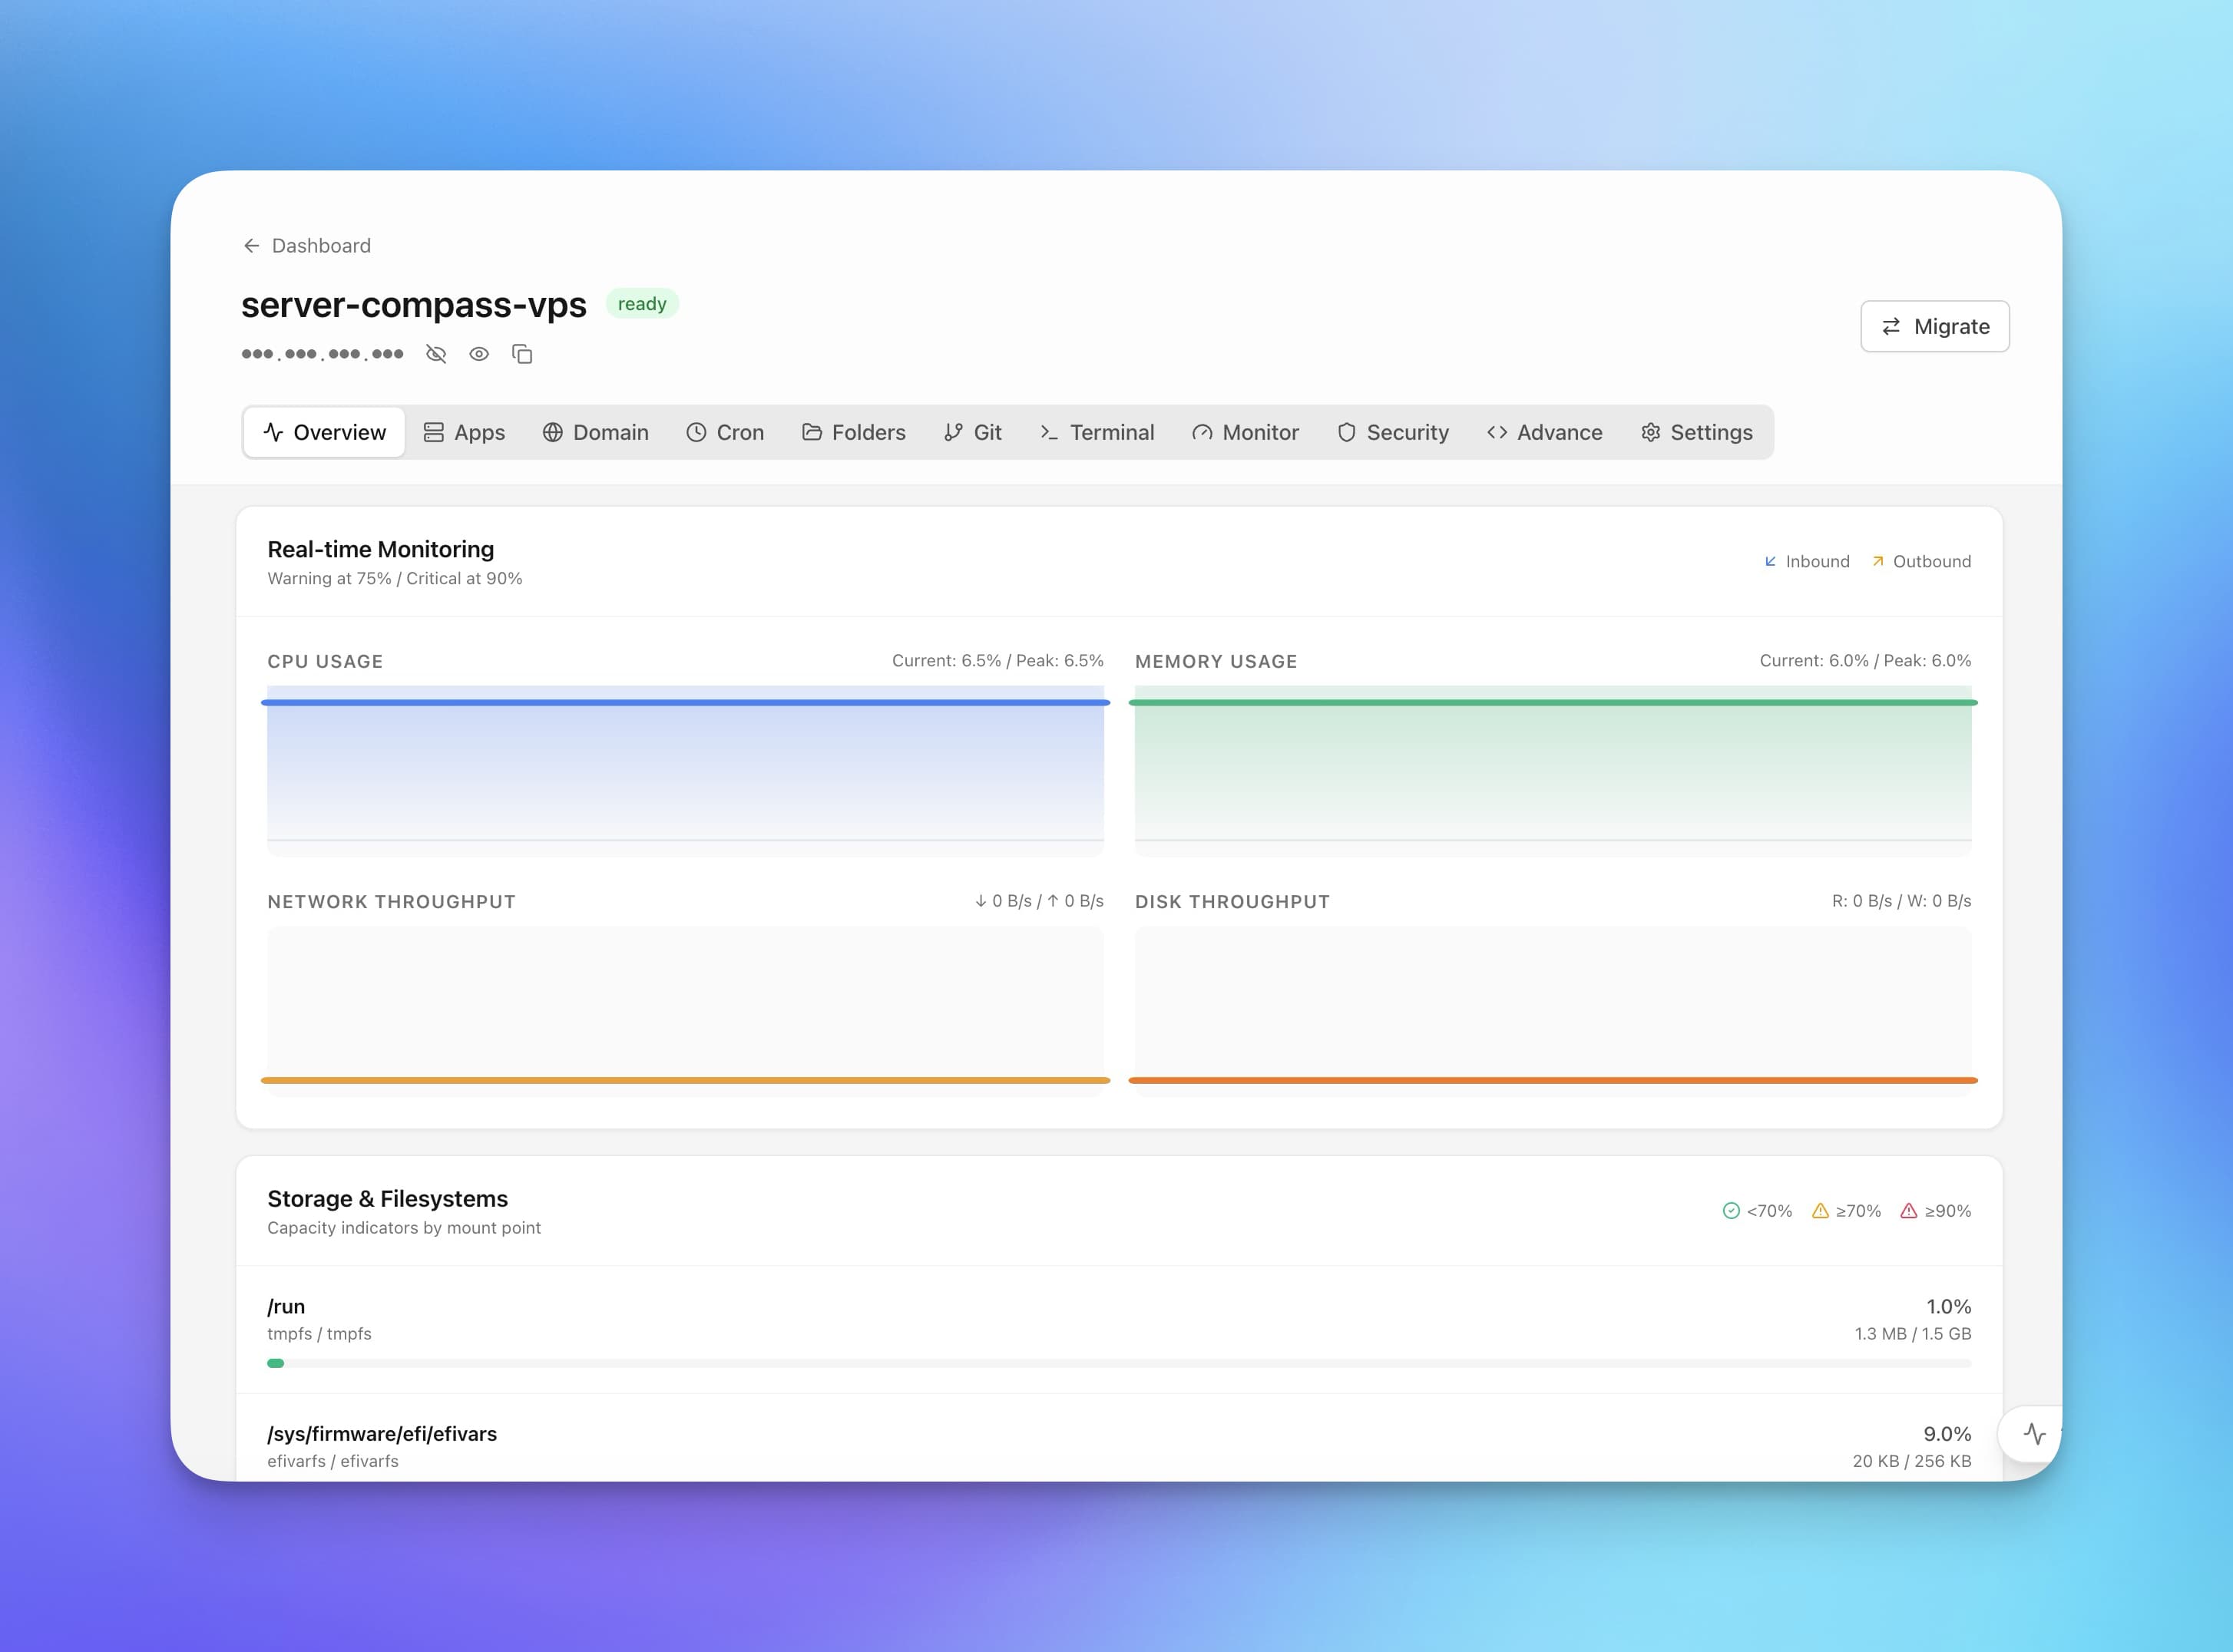
リアルタイムリソース使用状況を表示:
- CPU:現在および過去の CPU 利用率
- メモリ:使用済みと利用可能な RAM
- ディスク:パーティションごとのストレージ使用状況
- ネットワーク:帯域幅使用状況(監視エージェント付き)
詳細メトリクスと履歴グラフのためにオプションの監視エージェントをインストールします。
サーバー情報
情報パネルは以下を表示:
- オペレーティングシステムとバージョン
- サーバー場所(検出可能な場合)
- VPS プロバイダー
- IP アドレスとホスト名
- 認証方法
- 稼働時間
Screenshots
Related Features
Server Overview Dashboard
At-a-glance view of CPU, RAM, and disk usage. See OS info, auth method, location, and provider details.
Resource Monitoring
Real-time CPU, memory, and disk usage graphs. Track resource trends and identify bottlenecks.
Disks & Storage
See every disk on your server, with partitions and mount points grouped under each physical disk and attached volumes that were never mounted called out. Mount one from the app, with an optional /etc/fstab entry by UUID and nofail so the server still boots without it.
Ready to try Server Compass?
Download the app and deploy your first application in under 5 minutes.
Download Server Compass