ทำความเข้าใจ Server Dashboard
เรียนรู้วิธีใช้ dashboard overview ของ server เพื่อตรวจสอบ resources และจัดการ VPS ของคุณ
โครงร่าง dashboard
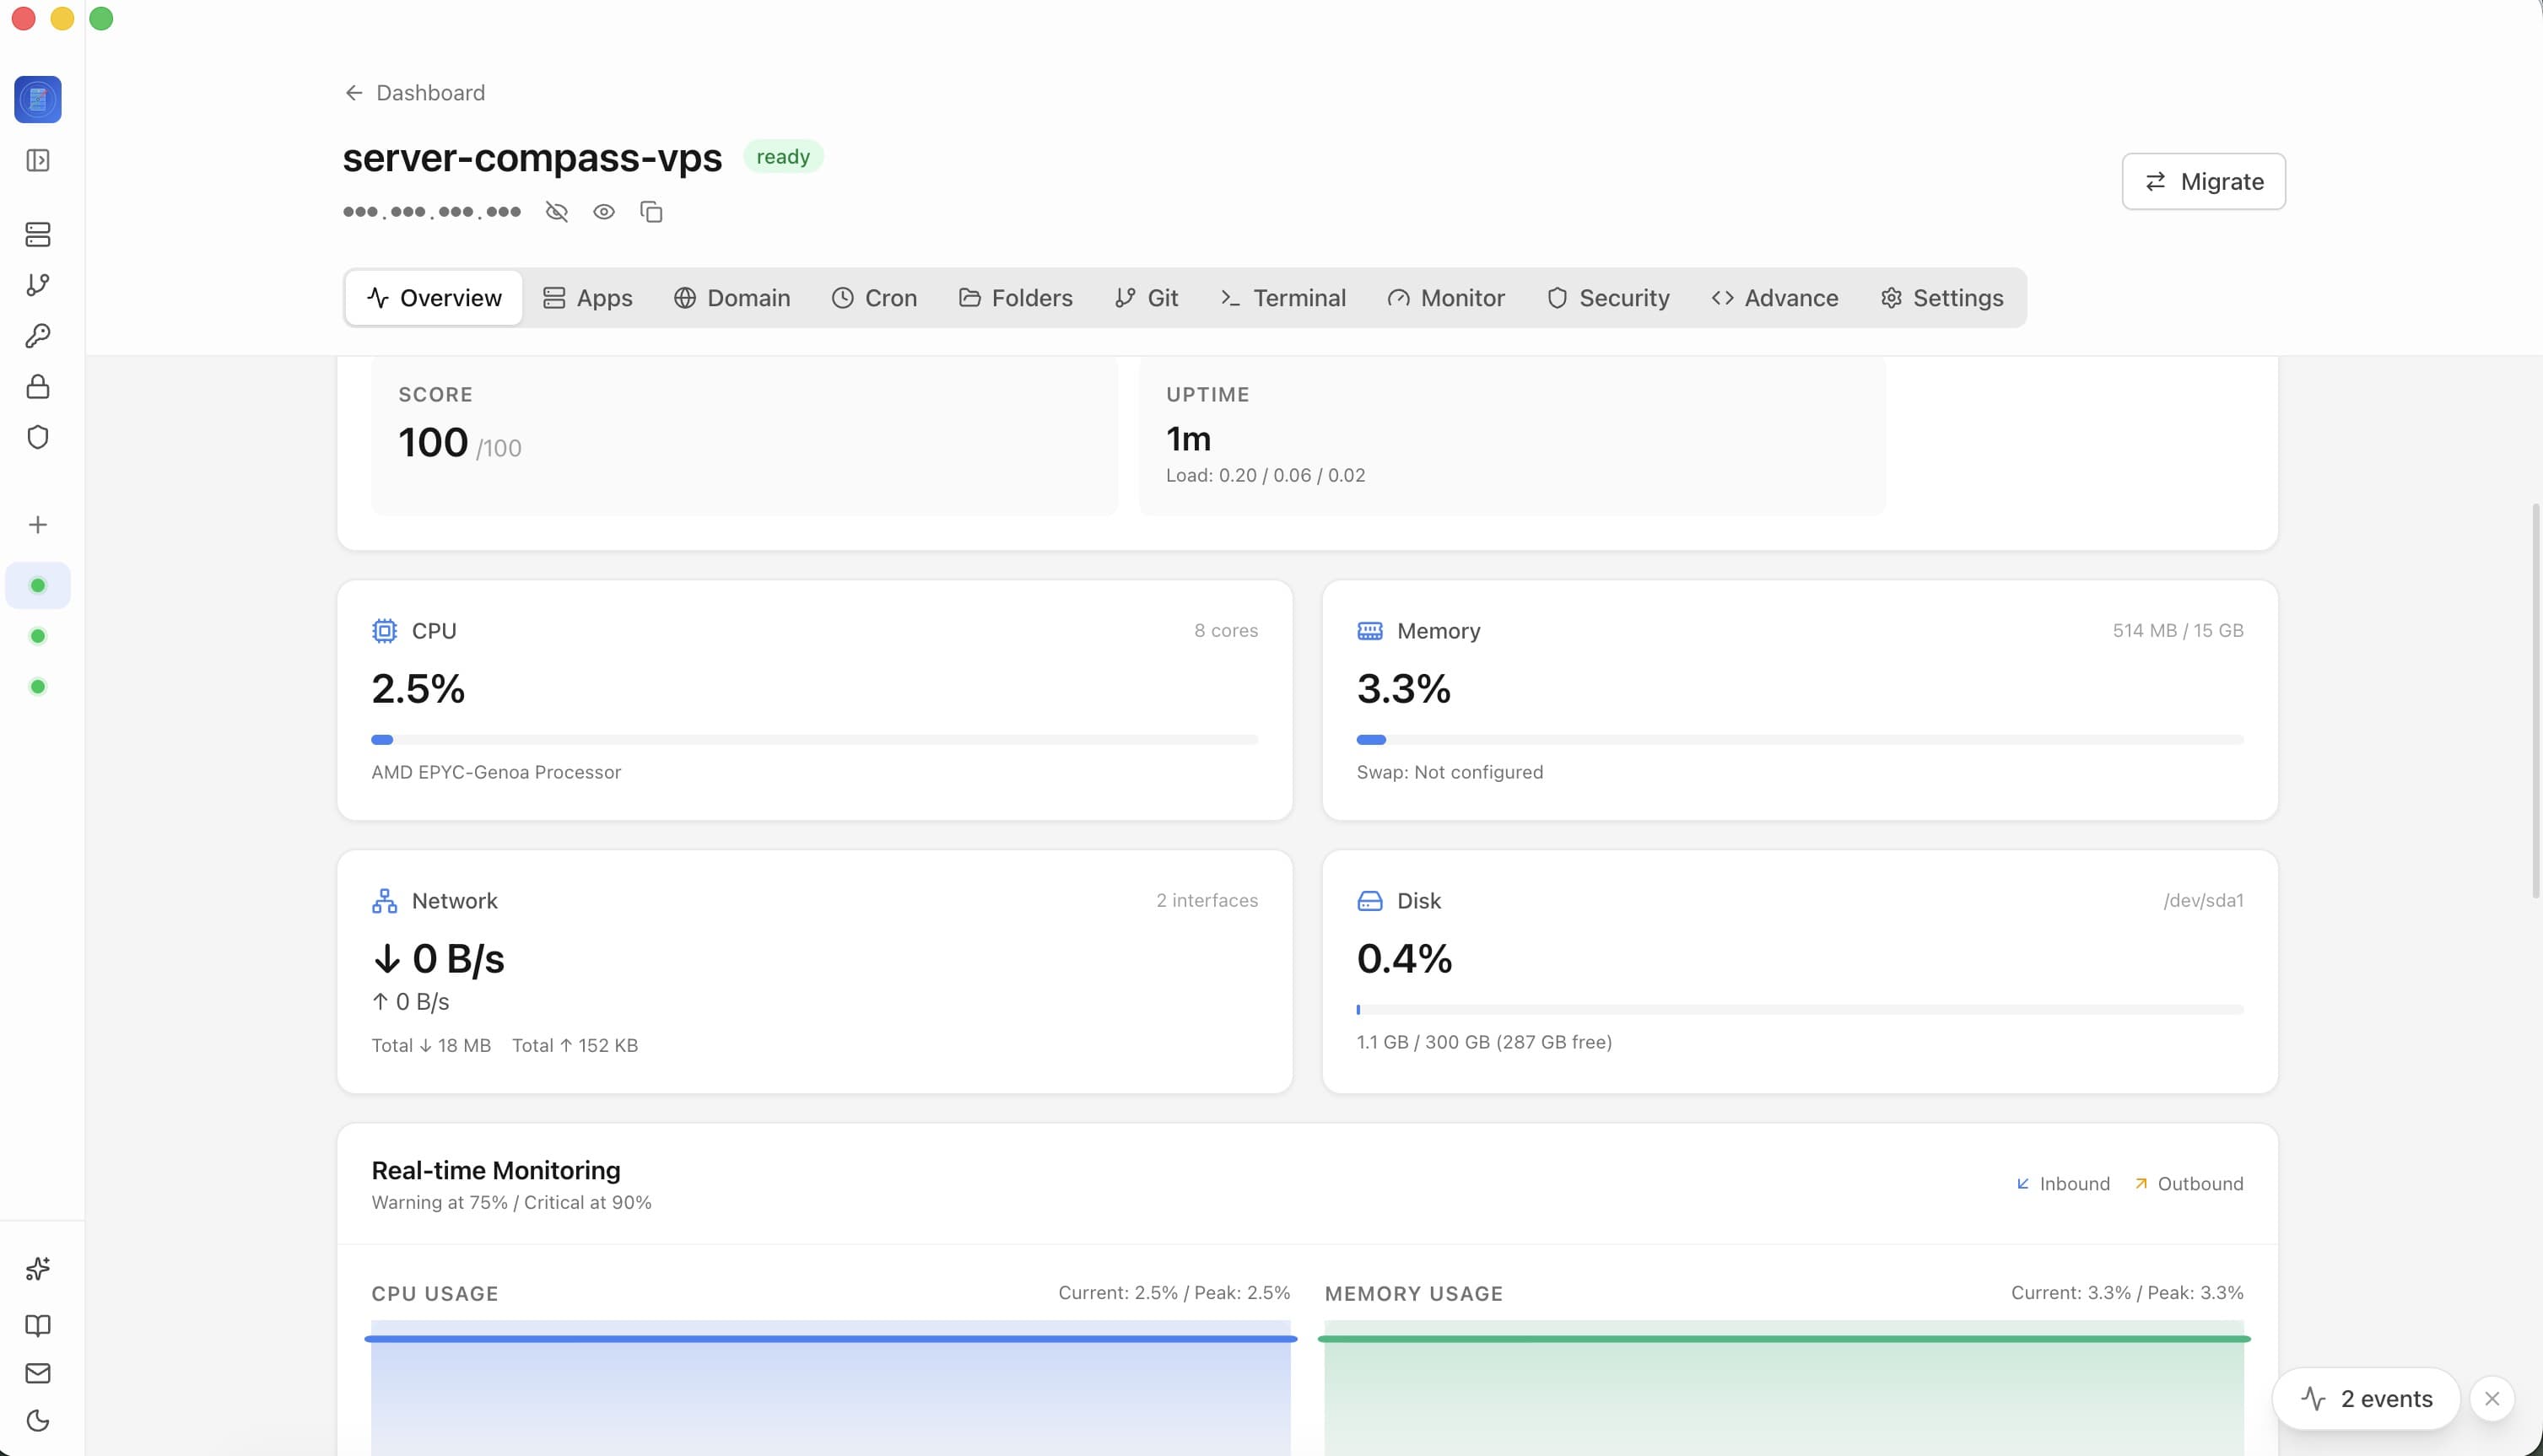
Server dashboard แสดง:
- Resource Usage: CPU, RAM และการใช้งาน disk ในภาพรวม
- Server Info: OS, ตำแหน่ง, provider, uptime
- Quick Actions: การตั้งค่า Docker, security audit, การเข้าถึง terminal
- Deployed Apps: รายการแอปพลิเคชันทั้งหมดบน server นี้
การตรวจสอบ resources
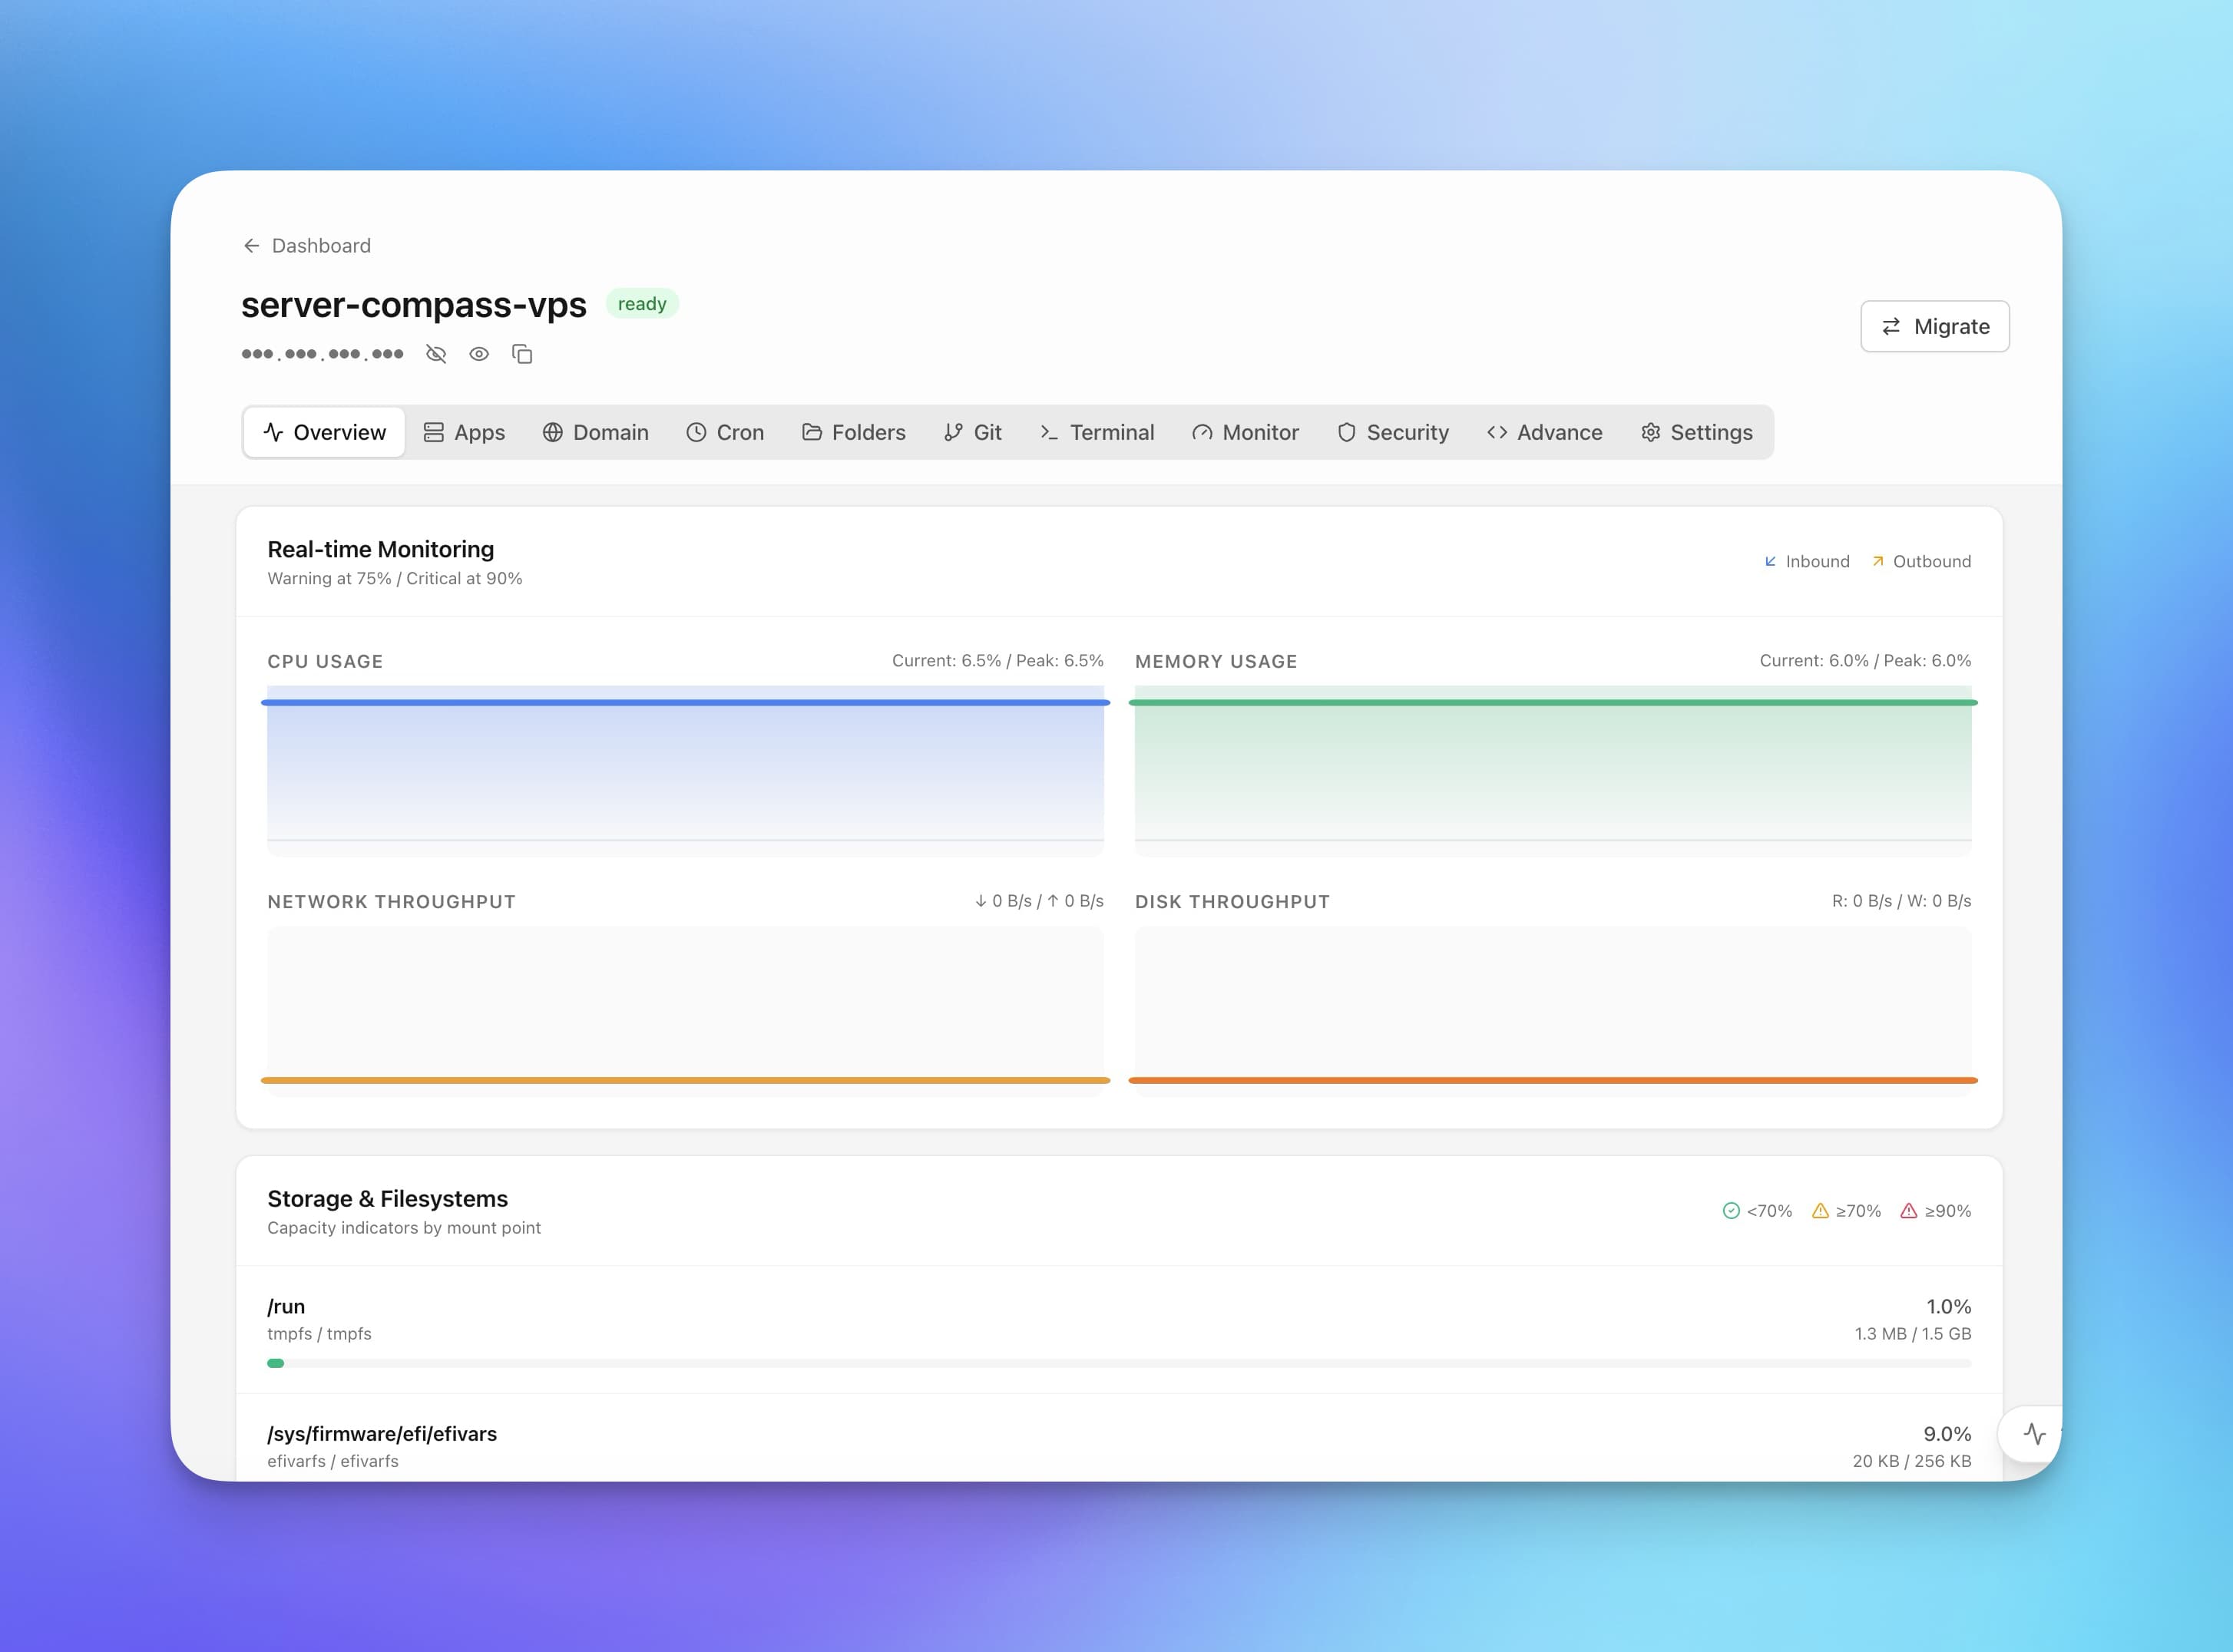
ดูการใช้งาน resources แบบ real-time:
- CPU: การใช้ CPU ปัจจุบันและย้อนหลัง
- Memory: RAM ที่ใช้เทียบกับที่มีอยู่
- Disk: การใช้พื้นที่เก็บข้อมูลต่อ partition
- Network: การใช้ bandwidth (พร้อม monitoring agent)
ติดตั้ง monitoring agent เพิ่มเติมสำหรับเมตริกโดยละเอียดและกราฟย้อนหลัง
ข้อมูล server
แผงข้อมูลแสดง:
- ระบบปฏิบัติการและเวอร์ชัน
- ตำแหน่ง server (หากตรวจจับได้)
- VPS provider
- ที่อยู่ IP และ hostname
- วิธียืนยันตัวตน
- Uptime
Screenshots
Related Features
Server Overview Dashboard
At-a-glance view of CPU, RAM, and disk usage. See OS info, auth method, location, and provider details.
Resource Monitoring
Real-time CPU, memory, and disk usage graphs. Track resource trends and identify bottlenecks.
Disks & Storage
See every disk on your server, with partitions and mount points grouped under each physical disk and attached volumes that were never mounted called out. Mount one from the app, with an optional /etc/fstab entry by UUID and nofail so the server still boots without it.
Ready to try Server Compass?
Download the app and deploy your first application in under 5 minutes.
Download Server Compass