April 5, 2026
Docker Compose Templates for Popular Developer Tools (Ready to Use)
Copy-paste Docker Compose templates for Grafana, Prometheus, PostgreSQL, Redis, Nginx, Traefik, n8n, Metabase, and more. Each template includes working YAML and setup instructions.
Every developer has been there: you need a monitoring stack, a database, or a reverse proxy running in Docker, and you spend 30 minutes piecing together a docker-compose.yml from scattered documentation, outdated blog posts, and GitHub issues. The YAML is wrong. The volumes are misconfigured. The environment variables have changed since the last major release.
This post gives you ready-to-use Docker Compose templates for the most popular developer tools. Each template is tested, uses named volumes for persistence, and includes brief setup instructions so you can go from zero to running in under five minutes.
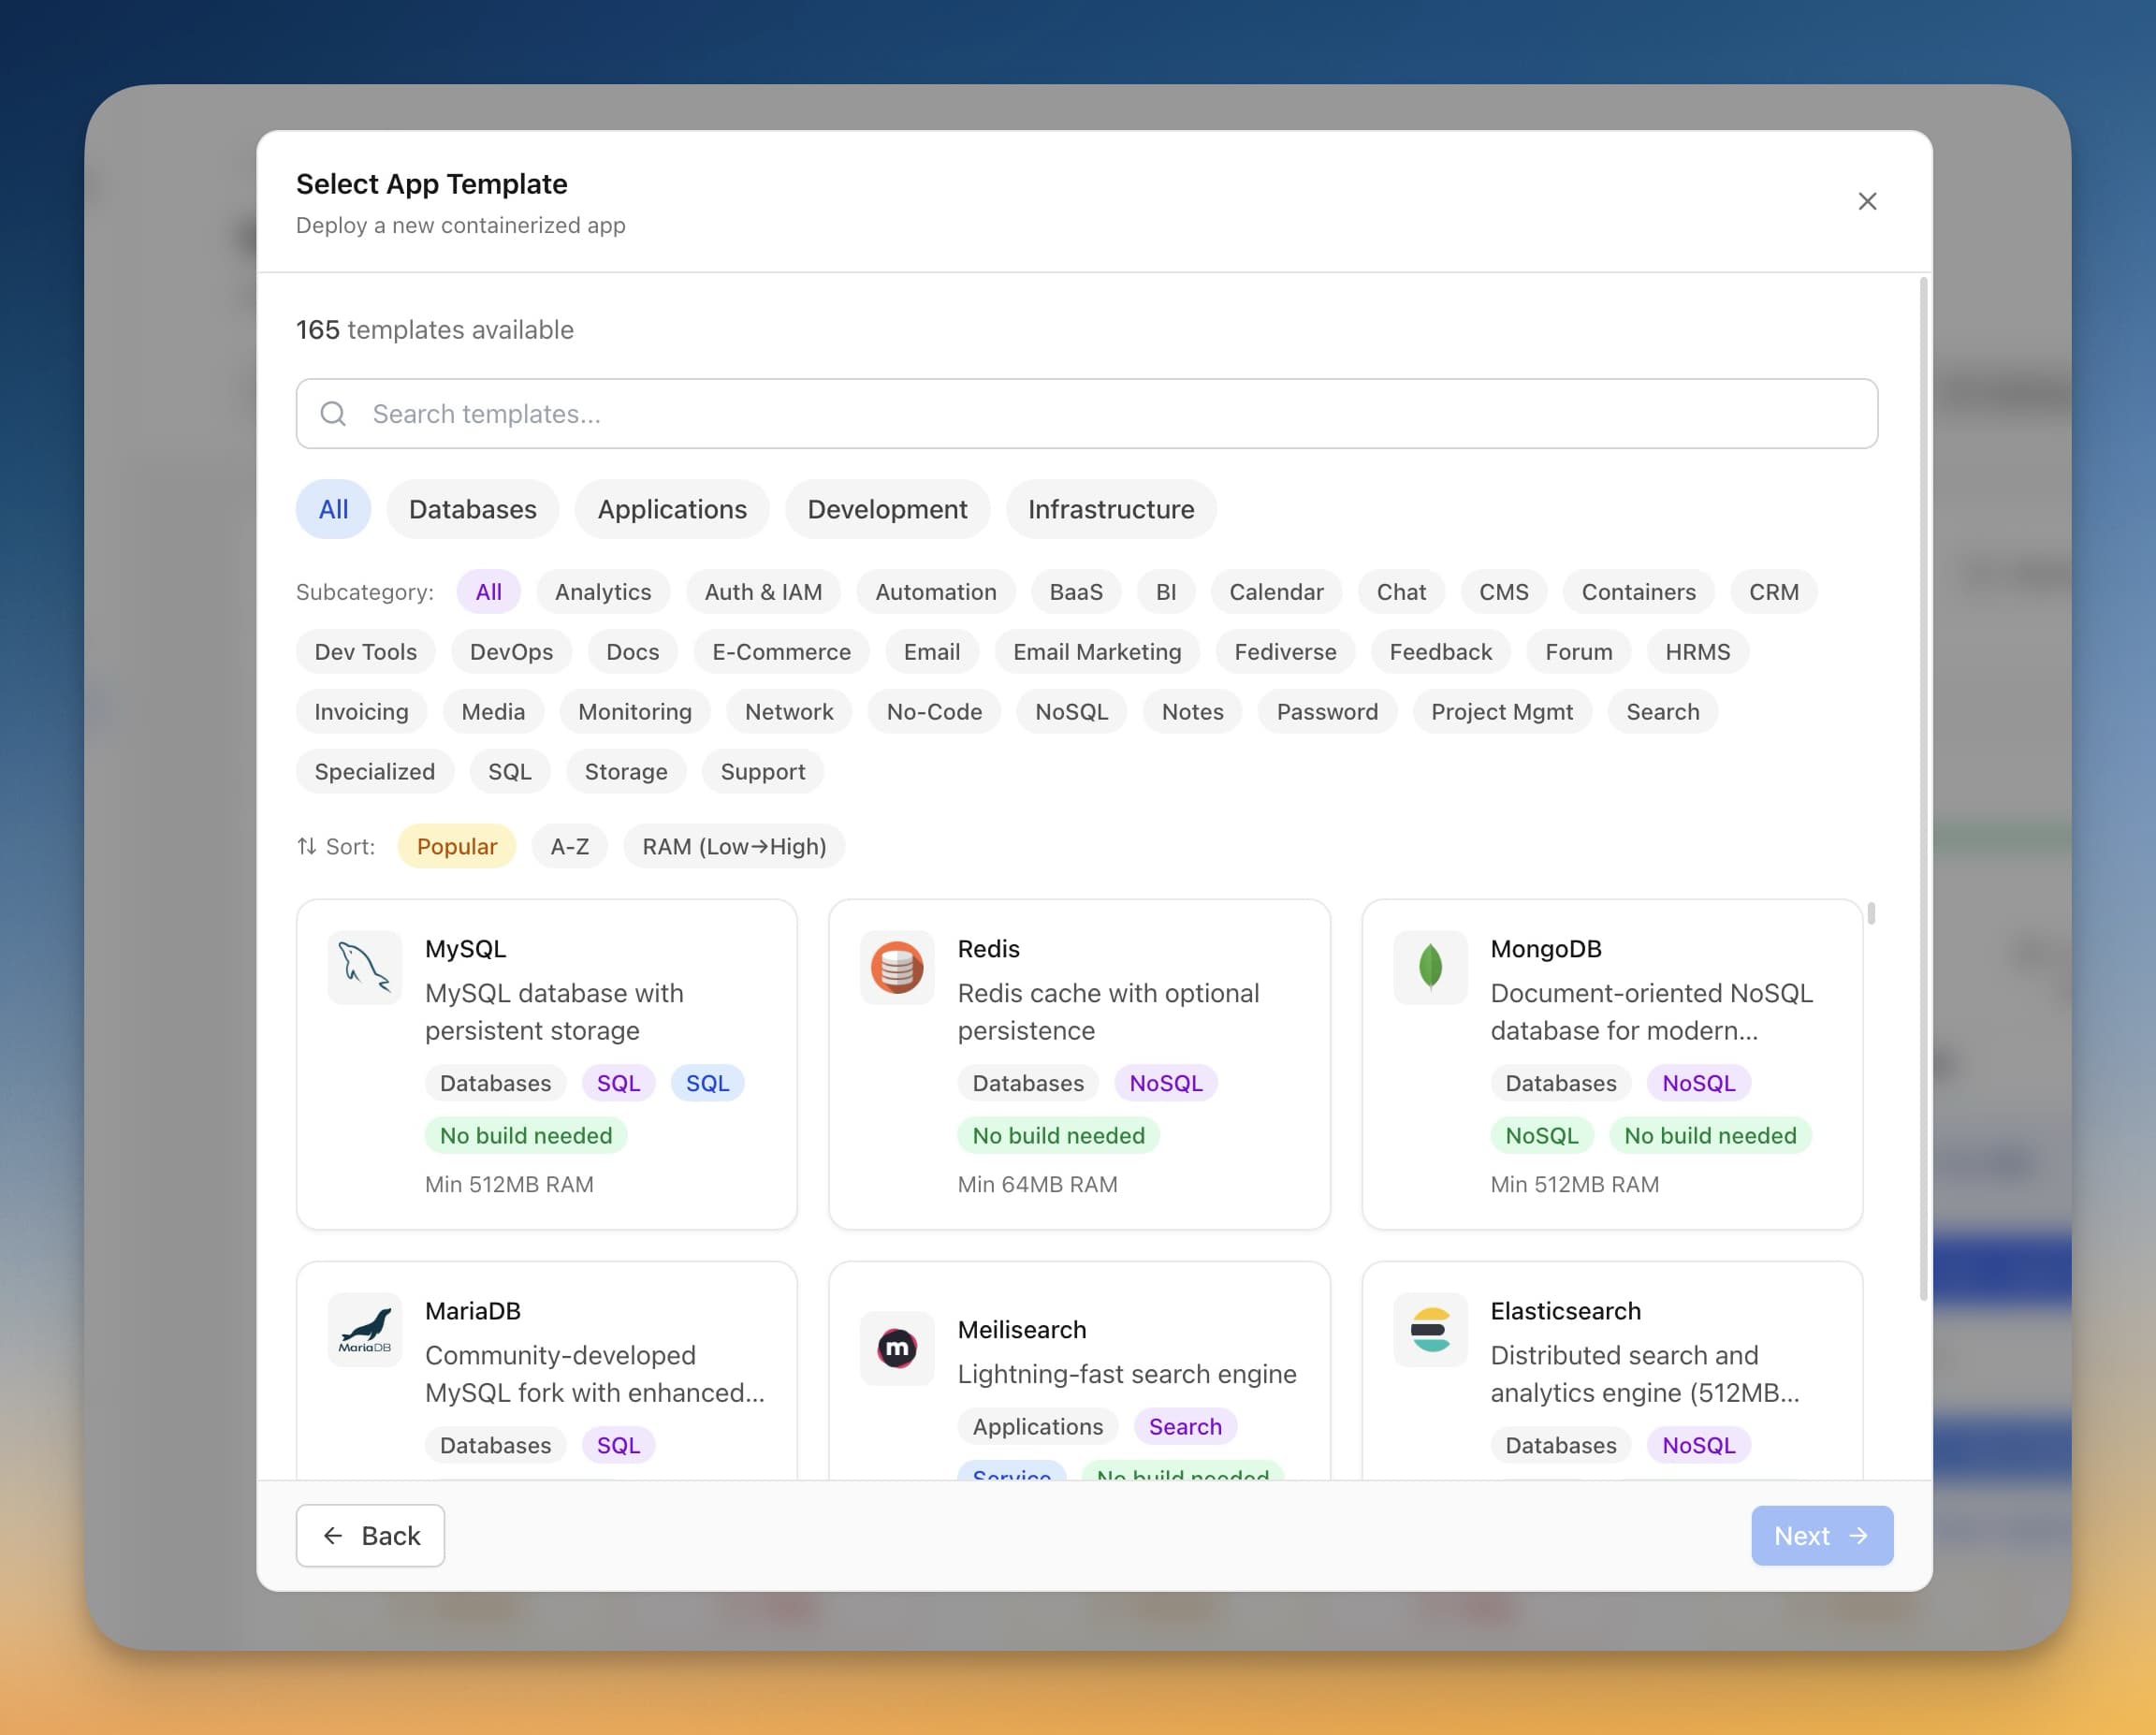
And if you'd rather skip the YAML entirely, Server Compass ships 247+ one-click templates that handle all of this for you — environment variables, volumes, networking, and port mappings pre-configured.
Databases
PostgreSQL
The most popular open-source relational database. This template includes persistent storage and a health check so dependent services can wait for the database to be ready.
version: "3.8"
services:
  postgres:
    image: postgres:16-alpine
    container_name: postgres
    restart: unless-stopped
    environment:
      POSTGRES_USER: admin
      POSTGRES_PASSWORD: changeme
      POSTGRES_DB: appdb
    volumes:
      - postgres_data:/var/lib/postgresql/data
    ports:
      - "5432:5432"
    healthcheck:
      test: ["CMD-SHELL", "pg_isready -U admin -d appdb"]
      interval: 10s
      timeout: 5s
      retries: 5

volumes:
  postgres_data:
After running docker compose up -d, connect with any PostgreSQL client using localhost:5432. Change POSTGRES_PASSWORD before deploying to a server. See our PostgreSQL template page or the full self-host PostgreSQL guide for production hardening tips.
Redis
In-memory data store used for caching, session management, and message brokering. This template enables append-only file persistence so your data survives restarts.
version: "3.8"
services:
  redis:
    image: redis:7-alpine
    container_name: redis
    restart: unless-stopped
    command: redis-server --appendonly yes --requirepass changeme
    volumes:
      - redis_data:/data
    ports:
      - "6379:6379"

volumes:
  redis_data:
Connect with redis-cli -a changeme or use it as a backend for your application. The --appendonly yes flag enables AOF persistence. Check the Redis template for the one-click version.
Monitoring and Observability
Grafana
The standard for dashboards and data visualization. Grafana connects to dozens of data sources including Prometheus, InfluxDB, PostgreSQL, and Elasticsearch.
version: "3.8"
services:
  grafana:
    image: grafana/grafana:latest
    container_name: grafana
    restart: unless-stopped
    environment:
      GF_SECURITY_ADMIN_USER: admin
      GF_SECURITY_ADMIN_PASSWORD: changeme
      GF_INSTALL_PLUGINS: grafana-clock-panel,grafana-piechart-panel
    volumes:
      - grafana_data:/var/lib/grafana
    ports:
      - "3000:3000"

volumes:
  grafana_data:
Open http://localhost:3000 and log in with the credentials above. Add your first data source under Connections > Data Sources. Our Grafana installation tutorial walks through connecting it to Prometheus and building your first dashboard.
Prometheus
Pull-based metrics collection and alerting. Prometheus scrapes targets at regular intervals and stores time-series data locally.
version: "3.8"
services:
  prometheus:
    image: prom/prometheus:latest
    container_name: prometheus
    restart: unless-stopped
    volumes:
      - prometheus_data:/prometheus
      - ./prometheus.yml:/etc/prometheus/prometheus.yml:ro
    ports:
      - "9090:9090"
    command:
      - "--config.file=/etc/prometheus/prometheus.yml"
      - "--storage.tsdb.retention.time=30d"

volumes:
  prometheus_data:
You will need a prometheus.yml configuration file in the same directory:
global:
  scrape_interval: 15s

scrape_configs:
  - job_name: "prometheus"
    static_configs:
      - targets: ["localhost:9090"]
Access the Prometheus UI at http://localhost:9090. Add additional scrape targets for your applications, Node Exporter, or cAdvisor. See the Prometheus setup tutorial for a full walkthrough.
Grafana + Prometheus Stack
The most common monitoring combo. This Docker Compose template runs both services on the same network so Grafana can reach Prometheus without exposing Prometheus to the public internet.
version: "3.8"
services:
  prometheus:
    image: prom/prometheus:latest
    container_name: prometheus
    restart: unless-stopped
    volumes:
      - prometheus_data:/prometheus
      - ./prometheus.yml:/etc/prometheus/prometheus.yml:ro
    ports:
      - "9090:9090"
    command:
      - "--config.file=/etc/prometheus/prometheus.yml"
      - "--storage.tsdb.retention.time=30d"

  grafana:
    image: grafana/grafana:latest
    container_name: grafana
    restart: unless-stopped
    environment:
      GF_SECURITY_ADMIN_USER: admin
      GF_SECURITY_ADMIN_PASSWORD: changeme
    volumes:
      - grafana_data:/var/lib/grafana
    ports:
      - "3000:3000"
    depends_on:
      - prometheus

volumes:
  prometheus_data:
  grafana_data:
After both services start, add Prometheus as a data source in Grafana using http://prometheus:9090 as the URL (Docker's internal DNS resolves the service name). Both templates are available as one-click deploys in Server Compass.
Reverse Proxies
Nginx
The most widely used reverse proxy and web server. This template serves static files or proxies requests to backend services.
version: "3.8"
services:
  nginx:
    image: nginx:alpine
    container_name: nginx
    restart: unless-stopped
    volumes:
      - ./nginx.conf:/etc/nginx/nginx.conf:ro
      - ./html:/usr/share/nginx/html:ro
    ports:
      - "80:80"
      - "443:443"
Create an nginx.conf file for your specific use case. For reverse proxying to a backend app on port 3000:
events { worker_connections 1024; }

http {
  server {
    listen 80;
    server_name yourdomain.com;

    location / {
      proxy_pass http://host.docker.internal:3000;
      proxy_set_header Host $host;
      proxy_set_header X-Real-IP $remote_addr;
      proxy_set_header X-Forwarded-For $proxy_add_x_forwarded_for;
      proxy_set_header X-Forwarded-Proto $scheme;
    }
  }
}
For a deeper dive into Nginx with SSL and domain configuration, read our guide on deploying with Nginx or see how Server Compass integrates with existing Nginx setups.
Traefik
A modern reverse proxy built for containers. Traefik automatically discovers services via Docker labels and provisions Let's Encrypt SSL certificates.
version: "3.8"
services:
  traefik:
    image: traefik:v3.0
    container_name: traefik
    restart: unless-stopped
    command:
      - "--api.insecure=true"
      - "--providers.docker=true"
      - "--providers.docker.exposedbydefault=false"
      - "--entrypoints.web.address=:80"
      - "--entrypoints.websecure.address=:443"
      - "--certificatesresolvers.letsencrypt.acme.httpchallenge=true"
      - "--certificatesresolvers.letsencrypt.acme.httpchallenge.entrypoint=web"
      - "[email protected]"
      - "--certificatesresolvers.letsencrypt.acme.storage=/letsencrypt/acme.json"
    ports:
      - "80:80"
      - "443:443"
      - "8080:8080"
    volumes:
      - /var/run/docker.sock:/var/run/docker.sock:ro
      - letsencrypt_data:/letsencrypt

volumes:
  letsencrypt_data:
The Traefik dashboard is available at http://localhost:8080. To expose a service through Traefik, add Docker labels to it:
{`labels:
  - "traefik.enable=true"
  - "traefik.http.routers.myapp.rule=Host(\`app.yourdomain.com\`)"
  - "traefik.http.routers.myapp.entrypoints=websecure"
  - "traefik.http.routers.myapp.tls.certresolver=letsencrypt"`}
Server Compass uses Traefik under the hood for zero-downtime deployments and per-domain security headers. It configures all of this automatically so you never have to write Traefik labels by hand.
Automation and Business Intelligence
n8n
A self-hosted workflow automation platform — think Zapier, but running on your own server with no per-execution limits.
version: "3.8"
services:
  n8n:
    image: n8nio/n8n:latest
    container_name: n8n
    restart: unless-stopped
    environment:
      N8N_BASIC_AUTH_ACTIVE: "true"
      N8N_BASIC_AUTH_USER: admin
      N8N_BASIC_AUTH_PASSWORD: changeme
      N8N_HOST: localhost
      N8N_PORT: "5678"
      N8N_PROTOCOL: http
      WEBHOOK_URL: http://localhost:5678/
    volumes:
      - n8n_data:/home/node/.n8n
    ports:
      - "5678:5678"

volumes:
  n8n_data:
Open http://localhost:5678 to access the workflow editor. n8n supports 400+ integrations out of the box. For a production setup with a custom domain, follow our n8n self-hosting tutorial or use the n8n one-click template.
Metabase
Open-source business intelligence that lets non-technical team members query databases and build dashboards without writing SQL.
version: "3.8"
services:
  metabase:
    image: metabase/metabase:latest
    container_name: metabase
    restart: unless-stopped
    environment:
      MB_DB_TYPE: postgres
      MB_DB_DBNAME: metabase
      MB_DB_PORT: "5432"
      MB_DB_USER: metabase
      MB_DB_PASS: changeme
      MB_DB_HOST: postgres
    volumes:
      - metabase_data:/metabase-data
    ports:
      - "3000:3000"
    depends_on:
      postgres:
        condition: service_healthy

  postgres:
    image: postgres:16-alpine
    container_name: metabase-db
    restart: unless-stopped
    environment:
      POSTGRES_USER: metabase
      POSTGRES_PASSWORD: changeme
      POSTGRES_DB: metabase
    volumes:
      - metabase_pg_data:/var/lib/postgresql/data
    healthcheck:
      test: ["CMD-SHELL", "pg_isready -U metabase -d metabase"]
      interval: 10s
      timeout: 5s
      retries: 5

volumes:
  metabase_data:
  metabase_pg_data:
Metabase starts at http://localhost:3000. The setup wizard walks you through connecting your data sources. This template uses PostgreSQL as Metabase's internal database instead of the default H2 file database, which is recommended for production. See the Metabase template for the one-click version.
More Essential Templates
Uptime Kuma
A self-hosted uptime monitoring tool with a clean UI. Supports HTTP, TCP, DNS, and ping checks with notifications via Slack, Discord, Telegram, and more.
version: "3.8"
services:
  uptime-kuma:
    image: louislam/uptime-kuma:latest
    container_name: uptime-kuma
    restart: unless-stopped
    volumes:
      - uptime_kuma_data:/app/data
    ports:
      - "3001:3001"

volumes:
  uptime_kuma_data:
Access the dashboard at http://localhost:3001 and create your first monitor. Uptime Kuma is one of the most popular self-hosted tools for good reason — it replaces paid services like Pingdom or UptimeRobot.
Portainer
A web UI for managing Docker containers, images, volumes, and networks. Useful for visual container management on your server.
version: "3.8"
services:
  portainer:
    image: portainer/portainer-ce:latest
    container_name: portainer
    restart: unless-stopped
    volumes:
      - /var/run/docker.sock:/var/run/docker.sock
      - portainer_data:/data
    ports:
      - "9443:9443"

volumes:
  portainer_data:
Open https://localhost:9443 to create your admin account. Portainer gives you a GUI for Docker, but if you want a more complete server management experience with deployment pipelines, database admin, and domain management built in, take a look at Server Compass's template deployment feature.
MinIO
S3-compatible object storage you can self-host. Use it for file uploads, backups, or as a storage backend for other services.
version: "3.8"
services:
  minio:
    image: minio/minio:latest
    container_name: minio
    restart: unless-stopped
    command: server /data --console-address ":9001"
    environment:
      MINIO_ROOT_USER: admin
      MINIO_ROOT_PASSWORD: changeme123
    volumes:
      - minio_data:/data
    ports:
      - "9000:9000"
      - "9001:9001"

volumes:
  minio_data:
The MinIO console is at http://localhost:9001 and the S3 API is on port 9000. Use any S3-compatible client or SDK to interact with it.
Docker Compose Tips for Production
These templates work for local development out of the box. Before deploying to a VPS, keep these best practices in mind:
- Change all default passwords. Every template above uses
changemeas a placeholder. Use a password manager oropenssl rand -base64 32to generate strong credentials. - Pin image versions. Replace
:latestwith a specific tag likepostgres:16.3-alpineorgrafana/grafana:11.1.0. This prevents unexpected breaking changes on restart. - Use named volumes. All templates above use named Docker volumes. Never use bind mounts to random host directories — named volumes are managed by Docker and easier to back up.
- Set resource limits. Add
deploy.resources.limitsto prevent a single container from consuming all your server's memory. - Add a reverse proxy. Do not expose application ports directly. Put Nginx or Traefik in front for SSL termination and domain routing.
- Set up backups. Docker volumes are not backed up by default. Use
docker run --rm -v volume_name:/data -v $(pwd):/backup alpine tar czf /backup/backup.tar.gz /dataor a cloud backup solution.
For a deeper guide on deploying Docker Compose to a VPS, see our Docker deployment guide without Kubernetes and the companion post on deploying apps with Docker Compose.
Skip the YAML: 247+ One-Click Templates
Writing Docker Compose files by hand works, but it gets tedious when you are deploying multiple services across multiple servers. Every tool has its own environment variables, volume paths, and port conventions to remember.
Server Compass ships with 247+ one-click templates for databases, monitoring tools, CMS platforms, automation tools, and more. Each template is pre-configured with the correct environment variables, persistent volumes, and networking. You pick the app, click Deploy, and it is running on your VPS in under a minute.
The built-in Docker Compose editor also lets you write and edit compose files visually if you need custom configurations. And the Docker Stack Wizard walks you through multi-container deployments step by step.
If you are managing one or more VPS instances and deploying containerized apps regularly, these templates are a starting point — but a tool that handles the entire lifecycle from deployment to monitoring to backups will save you significantly more time. Give Server Compass a try.
Related in the StoicSoft network
If you're self-hosting on a VPS or working through a deployment guide like the one above, DeployToVPS is the StoicSoft network's handbook for VPS deployment recipes — docker-compose, nginx, traefik, and common app self-hosts.
From across the StoicSoft network
Hand-curated reads on the same topic from sister sites in the StoicSoft family.
 1DevTool11 min read
Self-Hosted AI Coding Assistant Workflow: Practical Setup Guide
A self-hosted AI coding workflow needs more than model hosting. You need environment control, connector governance, and reproducible operations. This guide covers the practical stack.
Read on 1devtool.com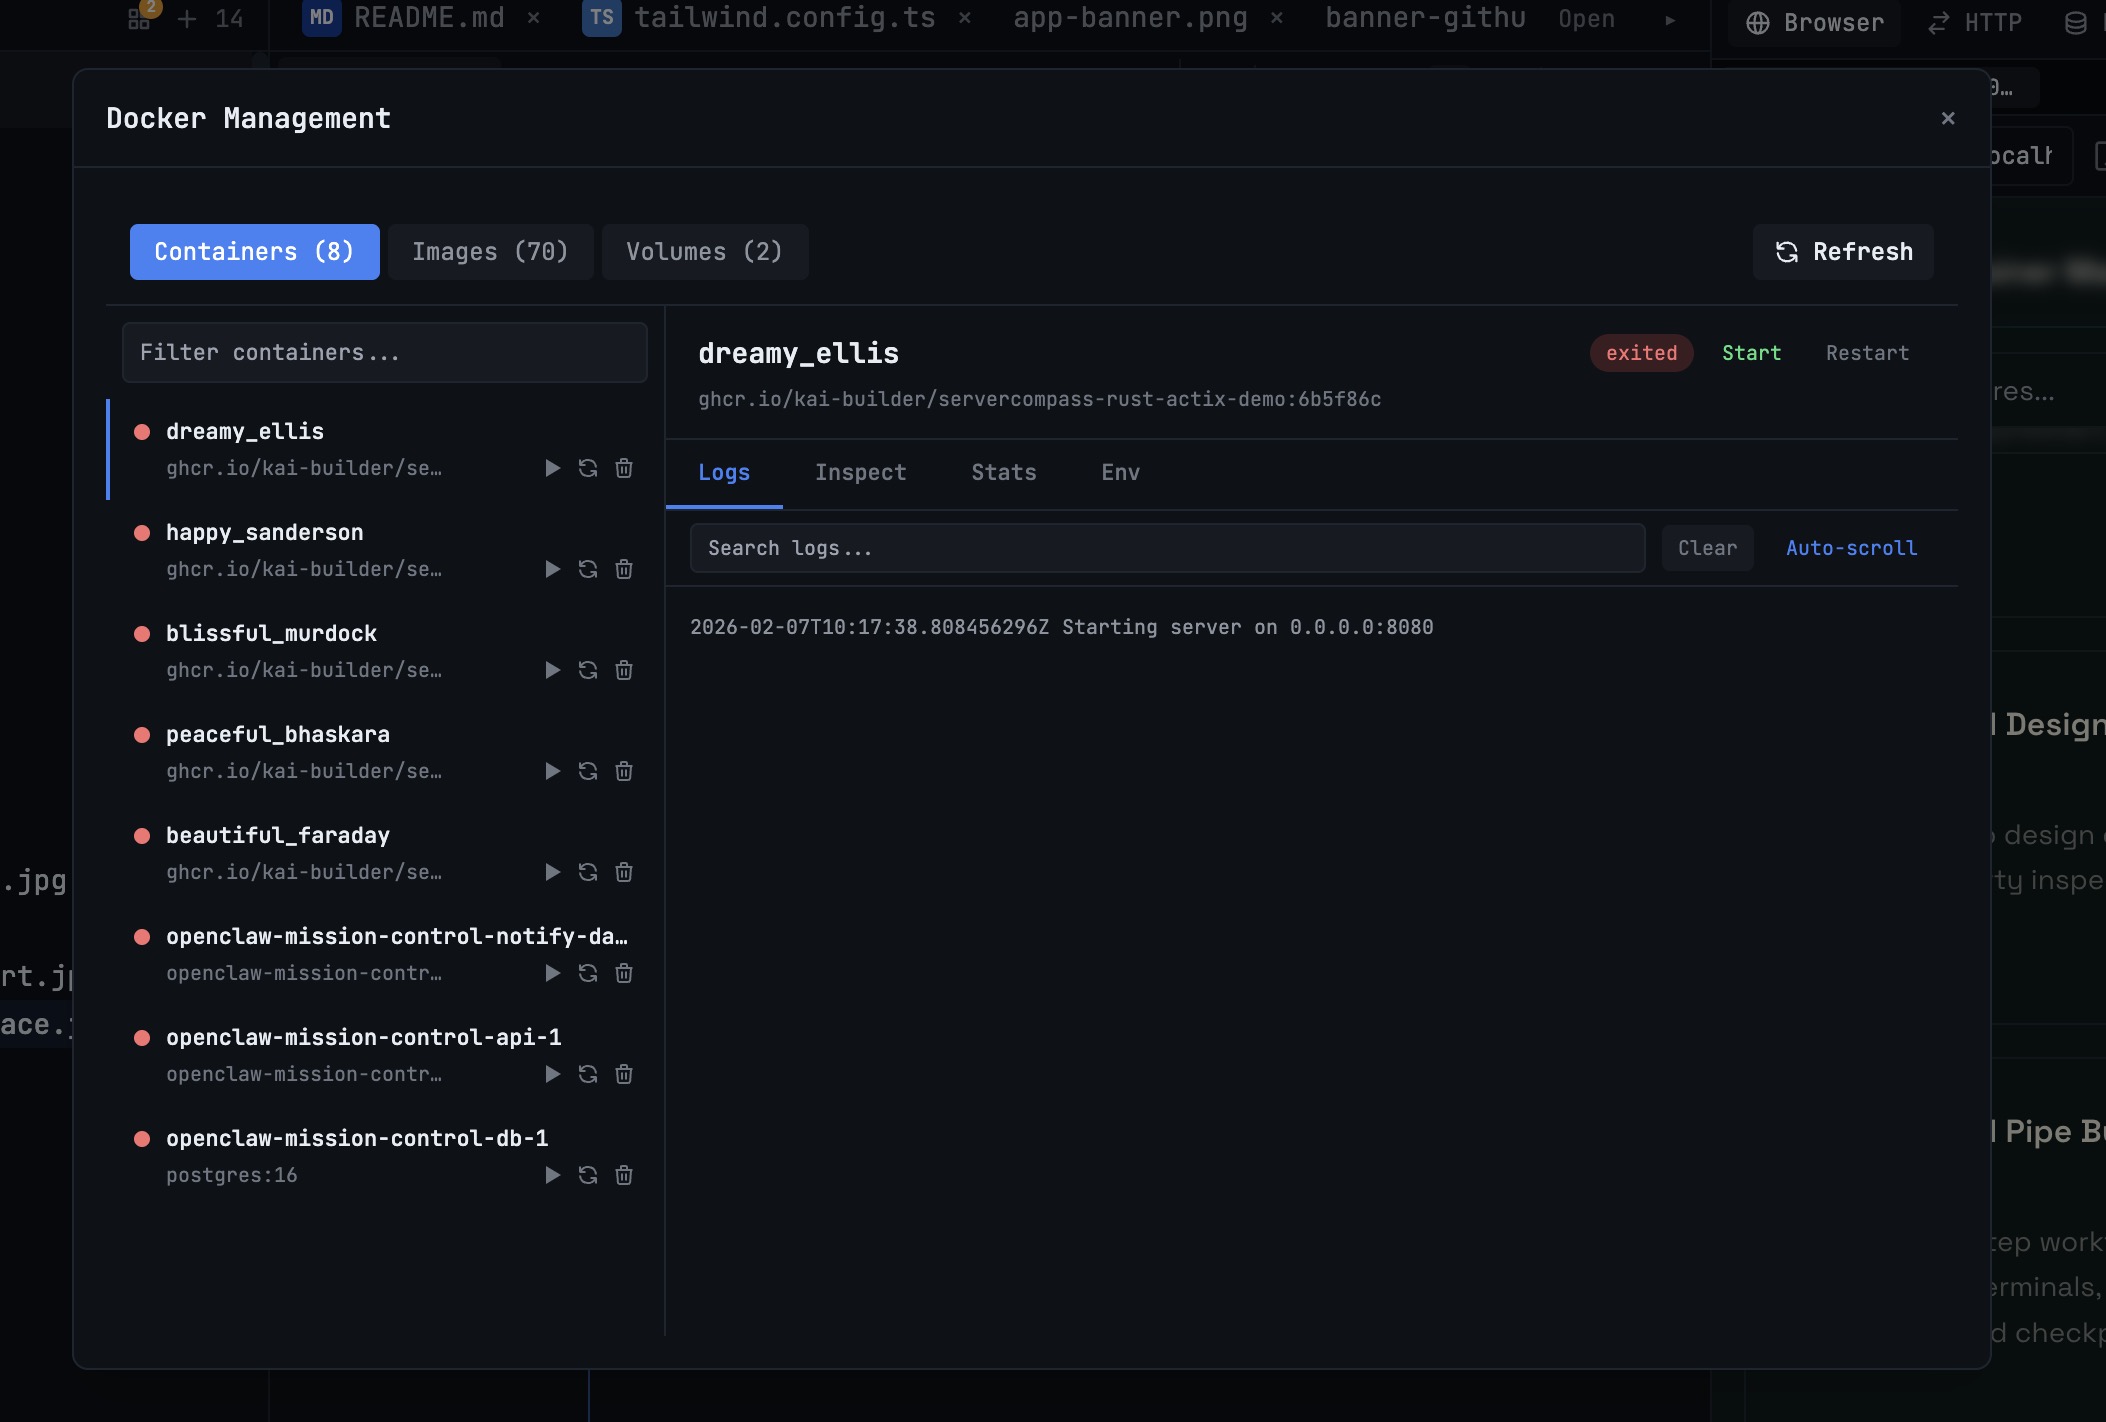 1DevTool10 min read
Docker Desktop Alternatives for Developers in 2026
Developers want a Docker workflow that stays close to code, logs, and AI agents. This comparison breaks down Docker Desktop alternatives by performance, observability, and daily usability.
Read on 1devtool.com