返回文档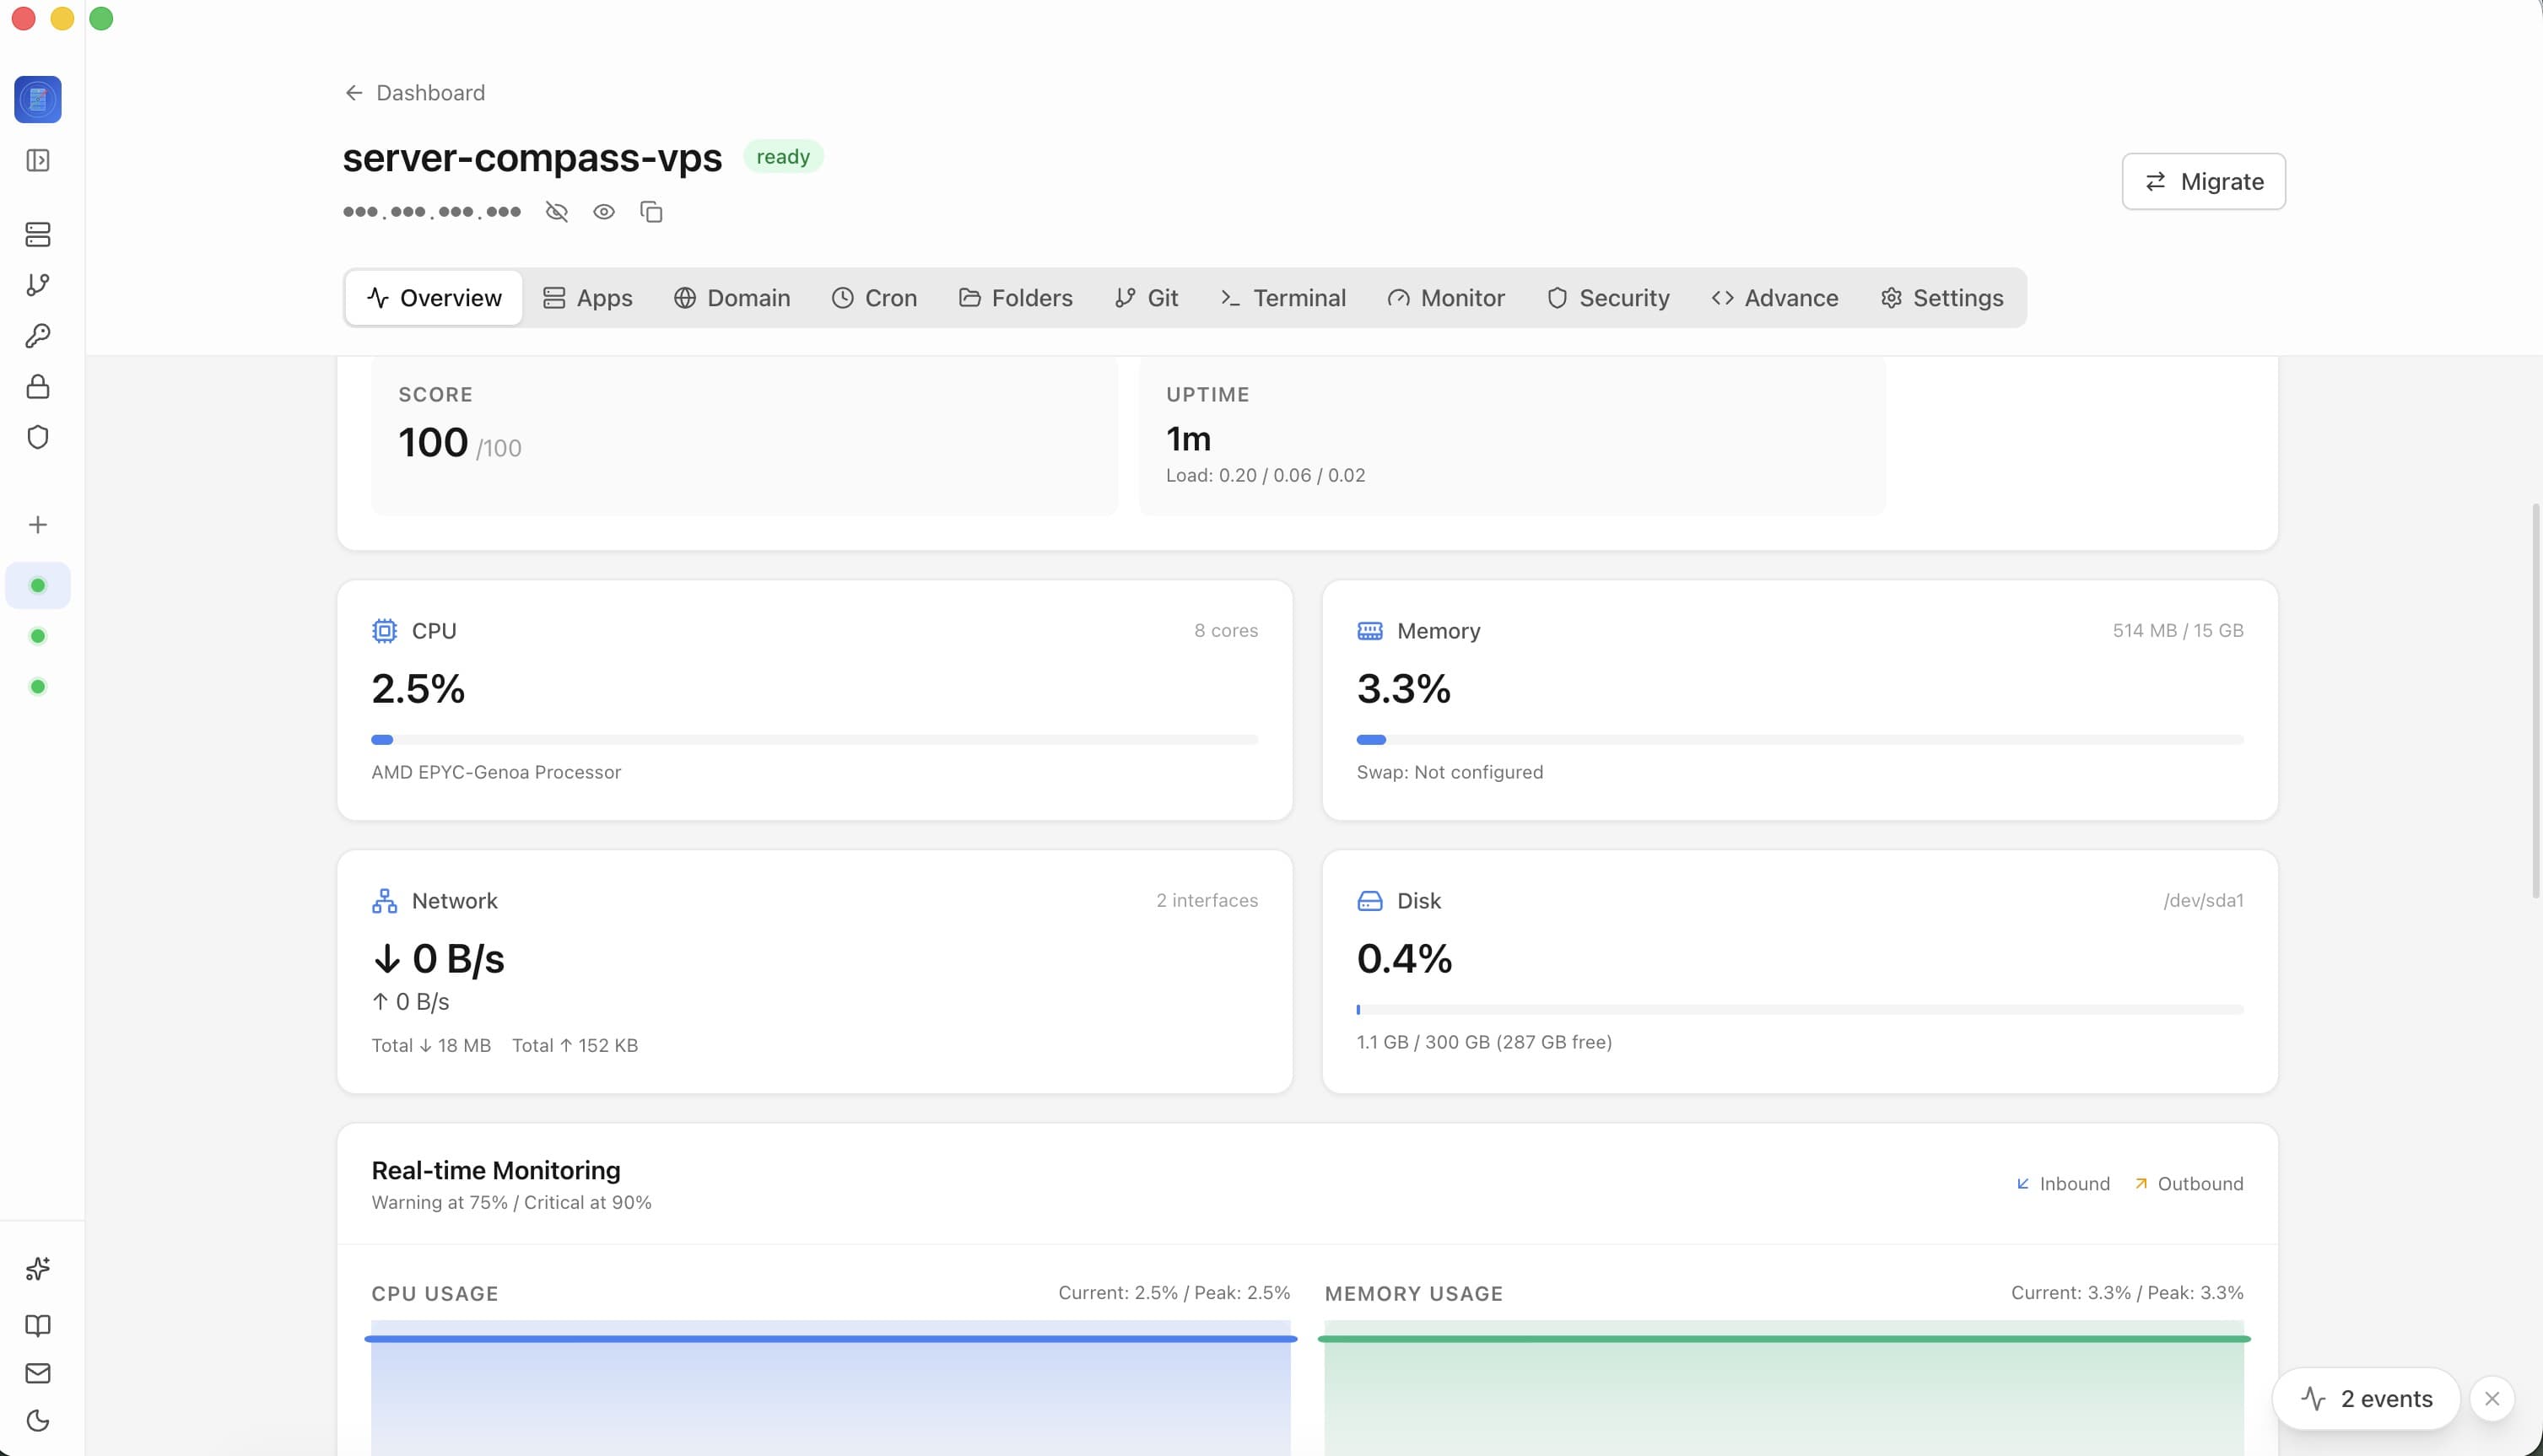
服务器管理
了解服务器仪表板
学习如何使用服务器概览仪表板监控资源和管理 VPS。
Beginner4 min readUpdated 2026-11-02
仪表板布局
服务器仪表板显示:
- 资源使用:CPU、RAM 和磁盘使用情况一目了然
- 服务器信息:操作系统、位置、提供商、运行时间
- 快速操作:Docker 设置、安全审计、终端访问
- 已部署应用:此服务器上的所有应用程序列表
资源监控
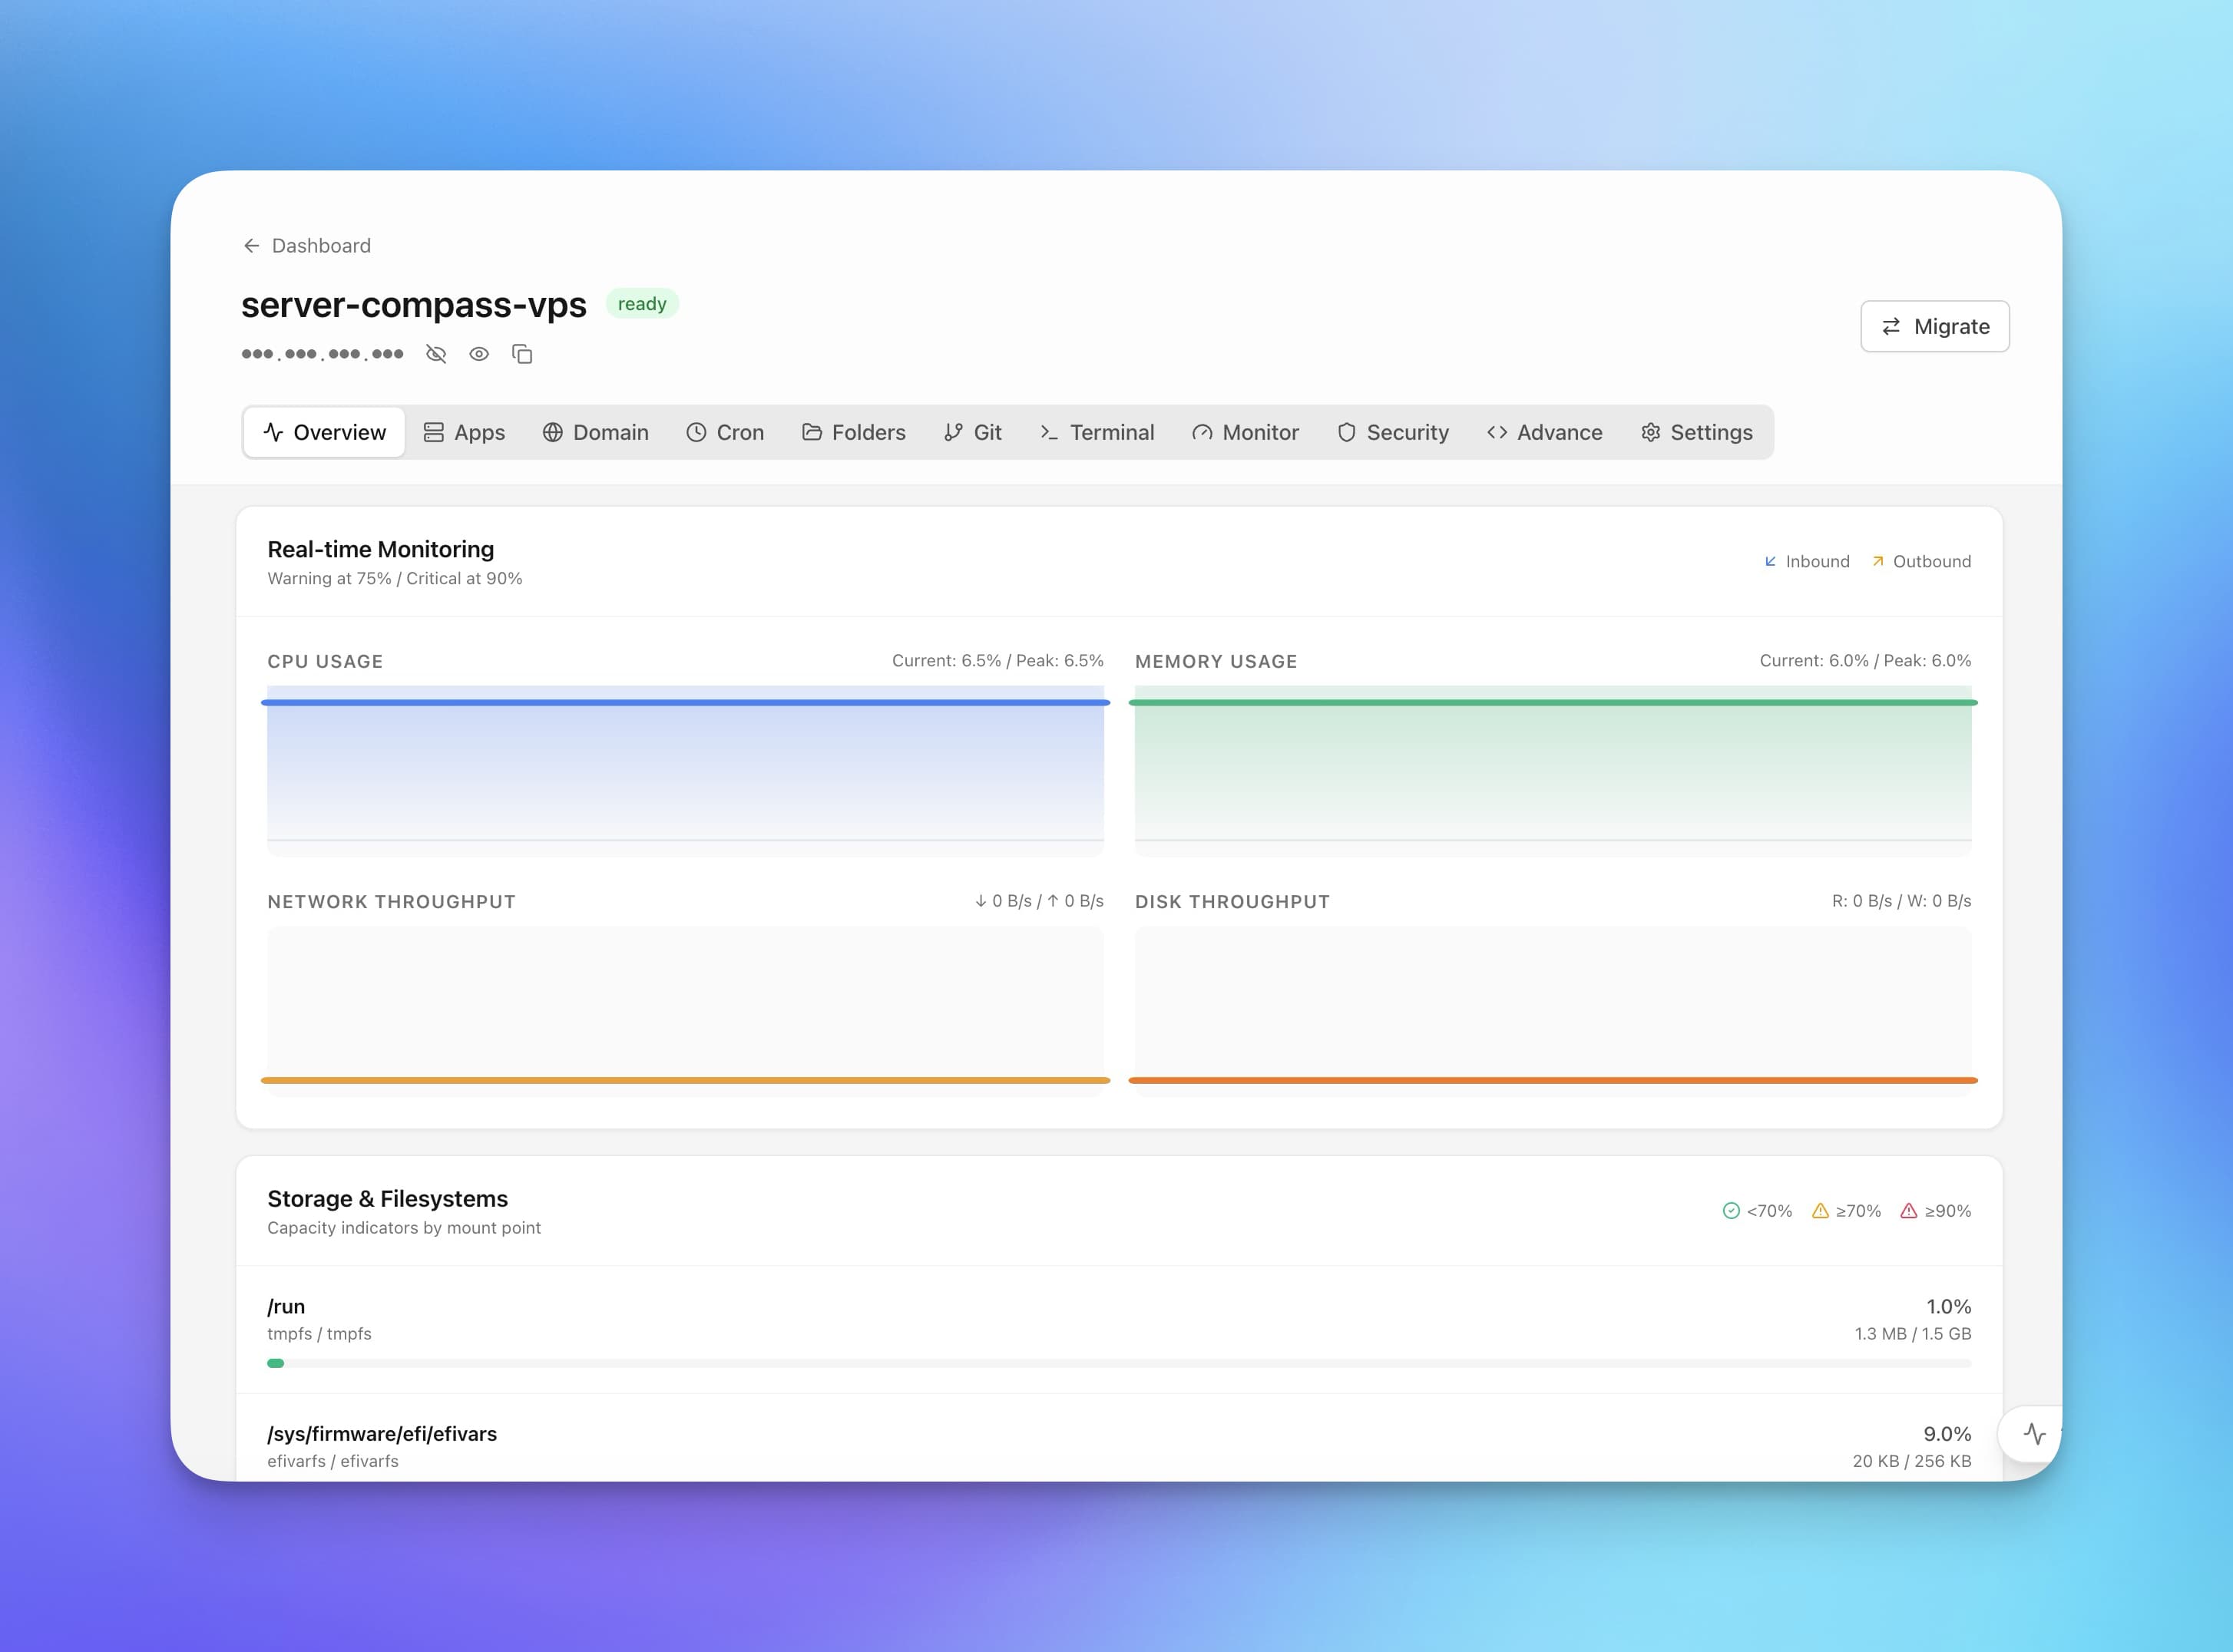
查看实时资源使用情况:
- CPU:当前和历史 CPU 利用率
- 内存:已用与可用 RAM
- 磁盘:每个分区的存储使用情况
- 网络:带宽使用情况(需安装监控代理)
安装可选的监控代理以获取详细指标和历史图表。
服务器信息
信息面板显示:
- 操作系统和版本
- 服务器位置(如果可检测)
- VPS 提供商
- IP 地址和主机名
- 认证方法
- 运行时间
Screenshots
Related Features
Server Overview Dashboard
At-a-glance view of CPU, RAM, and disk usage. See OS info, auth method, location, and provider details.
Resource Monitoring
Real-time CPU, memory, and disk usage graphs. Track resource trends and identify bottlenecks.
Disks & Storage
See every disk on your server, with partitions and mount points grouped under each physical disk and attached volumes that were never mounted called out. Mount one from the app, with an optional /etc/fstab entry by UUID and nofail so the server still boots without it.
Ready to try Server Compass?
Download the app and deploy your first application in under 5 minutes.
Download Server Compass